85 results
Elementary statistics independent work packets
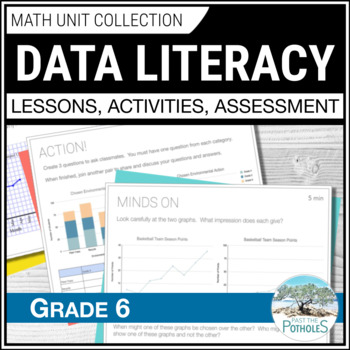
Data Management Unit: Reading Graphs Collecting & Analyzing Data Grade 6 Ontario
Save time and reduce stress!! This UPDATED Grade 6 Ontario Math Data Literacy unit has EVERYTHING YOU NEED. Students will learn about reading graphs, collecting data, analyzing data, misleading graphs, averages, and more. It includes 3-part Google Slides lessons, worksheets, games, centres, assessments, and report card comments. New histograms, broken-line graphs and infographic content are included with data analysis and data collection! SPECIFIC LESSON TOPICS:✓ Discrete and Continuous Data✓
Subjects:
Grades:
5th - 7th
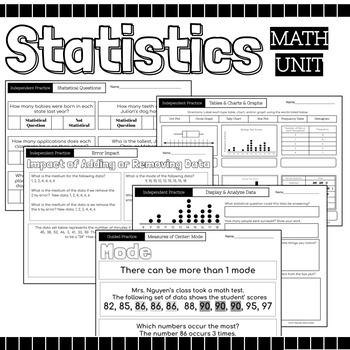
Statistics Math Packet {Data, Charts, Graphs, Mean, Median, Mode, Range, Spread}
52 Page Statics Unit Includes: Guided Instruction & Independent Practice Pages Usage Suggestions and IdeasThis resource can be utilized in numerous ways, here are some ideas:use for guided practiceassign as partner workassign as independent practicecan be used for morning workuse for reteaching in small group settinguse as review prior to assessmentuse as review in continuing to strengthen skillassign for homeworkuse as independent work during math centersTopicsRecognize Statistical Question
Subjects:
Grades:
4th - 12th
2024 Solar Eclipse Math - A Bank of 90 Math Problems About the Solar Eclipse
Combining math and science is a natural. With all the excitement surrounding the 2024 total solar eclipse, it only makes sense to extend our math knowledge and skills to the numbers involved with the incredible show that is about to take place in the sky. This resource contains a Bank of Math Problems for the 2024 Total Solar Eclipse. It includes 90 math problems (and answers) that involve the following skills: - Identifying the least and greatest values - Ordering numbers from least to greate
Subjects:
Grades:
4th - 7th
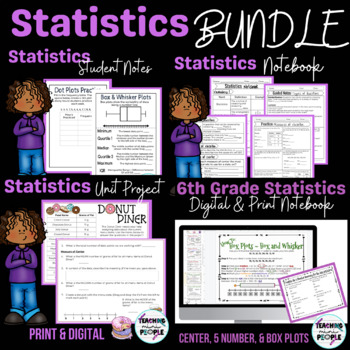
6th Grade Statistics | Measure of Center | Box Plots | 5 Number Summary
This Statistics Bundle is perfect for 6th graders who are learning about statistics. There are notes for you to teach your lesson with (anchor charts), a notebook set with guided practice and practice problems for each topic, vocabulary for each topic, digital or print practice with measure of center and box plots, and a unit project for the end to wrap it up. The digital notebook was recently added, by request! Statistics Notebook/Worksheets Include:➜ Statistics Vocabulary➜ Statistical Question
Subjects:
Grades:
5th - 7th
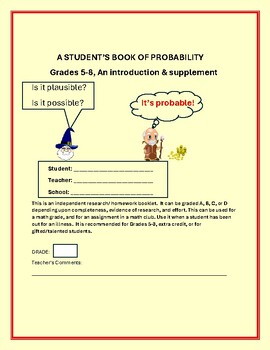
PROBABILITY: A STUDENT'S ACTIVITY/KNOWLEDGE BOOKLET GRADES 5-8, MG, & MATH CLUB
This is an independent activity booklet on probability. It is designed to enhance the learning of this mathematical theory. It has real life applications, a quiz, quotes, mystery quiz, biographies, and a writing prompt, etc. The intent is to show students how math is an integral part of life, and its functions. Answer keys are included. There is an art-design component for 2 activities, as well. This is a beginner-introduction/ supplement to this topic. Excelsior! Thank you ever so much for
Subjects:
Grades:
5th - 8th, Adult Education, Staff
Mean as a Balance Point for Google Classroom
This resource was designed for distance learning! It is completely editable and is so easy to assign in Google Classroom. This resource reviews the concept of mean and introduces the process of using a frequency line graph to calculate balance point. Be sure to make a copy for each student when assigning in Google Classroom!
Subjects:
Grades:
4th - 7th
Tree Diagrams and The Fundamental Counting Principle for Distance Learning
This probability resource was created for distance learning! This resource gives students the opportunity to practice creating probability tree diagrams virtually. Notes and an example scenario are given before students work through 3 additional scenarios on their own. This resource is ready to use and requires no prep! It is so easy to assign in Google Classroom!
Subjects:
Grades:
4th - 7th
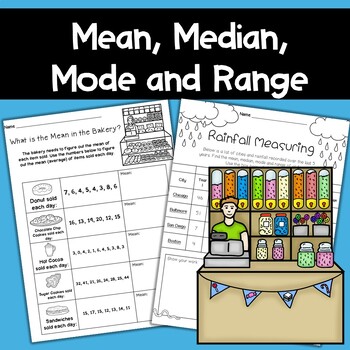
Mean Median Mode Range Worksheets - Introducing Data and Statistics
Students will enjoy solving averages using mean, median, mode and range when you purchase this product. This is the beginning of statistics for many of your students, so why not start them out enjoying this skill?!There are 14 student pages that include tables, clipart and real-world problems. All worksheets come with answer keys for easy grading. This product is great for students practicing their calculator skills and understanding concepts of organizing data. These worksheets are great for wh
Subjects:
Grades:
5th - 6th
Also included in: Entire Elementary Math Store - Growing Bundle K-5
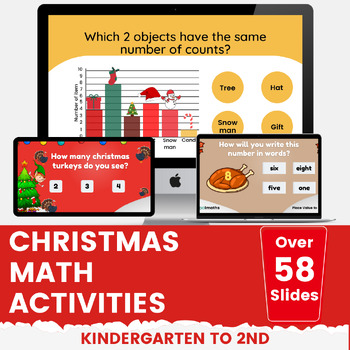
Christmas Math Activities No-Prep Bundle for Kindergarten to 2nd Grade
Christmas Math Activities No-Prep Bundle for Kindergarten to 2nd GradeUnlock the magic of the holiday season with our Christmas Digital Math Activity Bundle, specially designed for Kindergarten to 2nd-grade students. This comprehensive bundle is a perfect way to blend festive cheer with educational fun, focusing on place value to 10, place value to 20, place value to 100, counting to 10, addition and subtraction, reading and making tally charts and bar graphs.Inside this bundle, you'll find a tr
Grades:
K - 2nd
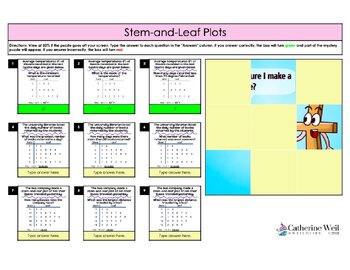
Math Mystery Puzzles: Data Displays
This self-correcting mystery puzzle is in Google Sheets. As students enter the correct answers the picture reveals itself. Box is red if the answer is wrong and green if the answer is correct - along with a puzzle piece reveal.This puzzle is an extension to Ch 10: Data Displays, Notes and Homeworkand Ch 10: Data Displays, Skill Check*Fun and engaging*Great for review*Self-correcting*Thank you LindsayBowden.com for the template!*You May Also Be Interested In:6th Grade Big Ideas, Notes and Homewor
Subjects:
Grades:
5th - 7th
Types:
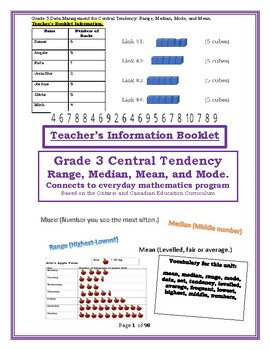
Grade 3 Data Management for Central Tendency: Range, Median, Mode, and Mean.
Grade 3 Unit 13: Data Management for Central Tendency: Range, Median, Mode, and Mean.Please see “Preview” for more information on the complete workbook. Grade 3 Maths Program Based on the Ontario and Canadian Curriculum. 100% connected to the Ontario and Canadian 2022 Curriculum with a rubric.With Connections to EQAO sample questions from 2006 to 2022, to introduce the math language to the grade 3 students. Save time and money on your maths program. No need to copy; stress the
Subjects:
Grades:
3rd, Staff
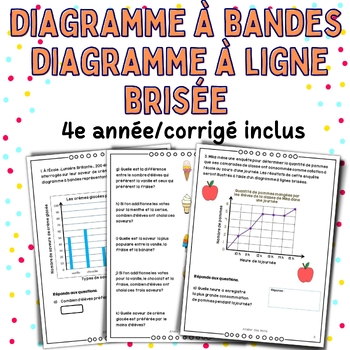
Math Worksheet 4th grade-Le diagramme à bandes Le diagramme à ligne brisée 4e
Ressource pour consolider ou réviser le diagramme à bandes et le diagramme à ligne brisée. Cette ressource inclut des exemples de diagrammes à analyser pour recueillir des données, ainsi que des modèles de diagrammes à compléter en utilisant les informations fournies.Elle peut être utilisée en ateliers et centres de mathématique, comme travail supplémentaire ou devoir. Il convient aussi pour l’apprentissage à domicile. Je vous encourage à vérifier les aperçus pour juger si le document convient à
Subjects:
Grades:
4th
Also included in: Math Bundle Worksheets 4th grade - Ensemble de mathématique 4e année
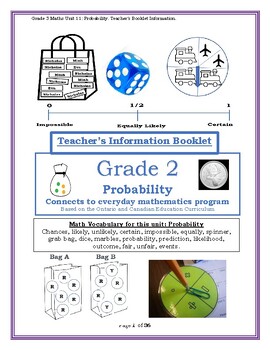
Probability: Grade 2 Maths Unit 11 Probability Complete Workbook.
D2. Probability: Grade 2 Maths Unit 11 Probability.Please see “Preview” for more information on the complete workbook.Grade 2 Maths Program Based on the Ontario and Canadian Curriculum. 100% connected to the Ontario and Canadian 2022 Curriculum with a rubric.With connections to provincial sample questionings, to introduce the math language to the grade 2 students. Save time and money on your maths program. Connects to many of the grade 2 social sciences, including financial and coding curriculu
Subjects:
Grades:
2nd
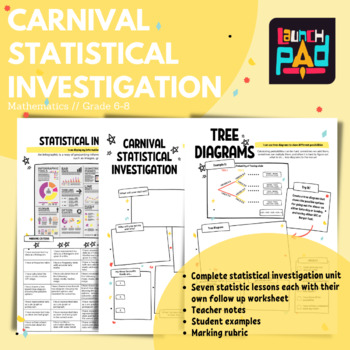
Carnival Statistical Investigation // Full Unit
You have been asked to run a stall at the Famous City Carnival! It is up to you what you sell, however, you want to make the most profit possible. It is important that you gain an understanding of what people like so that you make sales. You will need to complete a statistical investigation to create the stall as well as show your understanding and application of statistics. Students will learn and then apply statistical knowledge in each lesson of this unit and at the end create an infographic
Subjects:
Grades:
4th - 8th
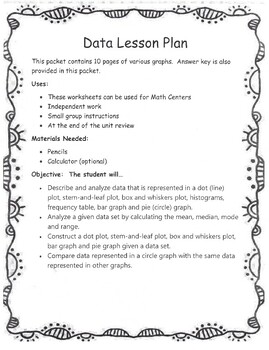
Using Data to Construct and Analyze Graphs - (Math Center/Data Unit Review)
This packet contains 10 worksheets that can be used for Math centers or the End of Unit Review. You can create a booklet and have your student complete one page a day. Students can work independently, with a partner or in groups. The packet contains Line (Dot) Plots, Stem-and-leaf plots, box-and-whisker plots, frequency tables, histograms, bar graphs, and Pie (circle) graphs. Students will describe and analyze the data on the graphs. They will calculate the mean, median, mode, and range. Gi
Subjects:
Grades:
5th - 7th
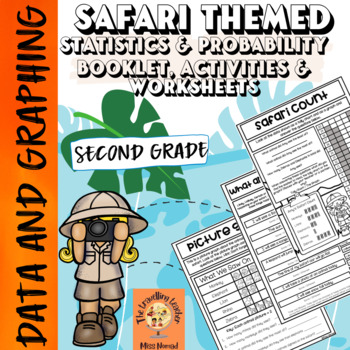
Second Grade Math: Data & Graphing Printable Booklet, Worksheets & Activities
This African Safari Themed Data & Graphing Printable Worksheets and Activity Pack features 19 different pages of printables and activities. This resource will bring the excitement of a safari and the students' love of animals into your maths lessons! It has minimal preparation, only requiring you to print the copies for your students with a fun activity at the end. It also comes with an answer key!This resource has been designed and aligned with the Year 2 Australian Curriculum, however, it
Subjects:
Grades:
1st - 3rd
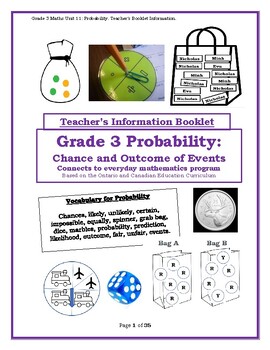
Grade 3 Maths Unit 11: Probability.
Grade 3 Maths Unit 11: Probability.Please see “Preview” for more information on the complete workbook. Grade 3 Maths Program Based on the Ontario and Canadian Curriculum. 100% connected to the Ontario and Canadian 2022 Curriculum with a rubric.With connections to provincial sample questionings, to introduce the math language to the grade 2 students. Save time and money on your maths program. Connects to many of the grade 2 social sciences, including financial and coding curriculum. Social Emo
Subjects:
Grades:
3rd

Science Fair Weekly Assignment Packet
Do you struggle to help your students pace themselves through science fair projects? This packet helps to break the process down into manageable steps for students, and allows you weekly touch points with students to ensure their success. There is an overview of each assignment, and then space for the student to respond. I provide this packet to my students both on paper and via our LMS so they can always access what they need to do each week. This packet walks students through the independe
Subjects:
Grades:
5th - 8th
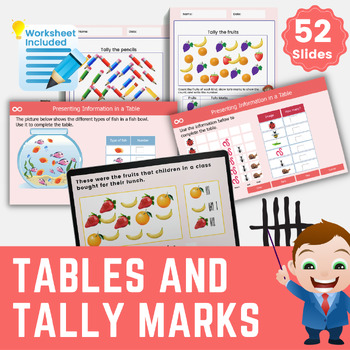
Tables and Tally Charts First Grade Interactive Activities CCSS.1.MD.C.4
This amazing completely interactive lesson with differentiated activities will allow 1st-grade class to interpret and construct simple tally charts and tables. Based on the first grade Common Core State Standards for interpreting and measuring data.Teachers can use the lesson for whole-class teaching as well as at home by learners.There are lots of drag and drop tally charts activities with instant feedback.The lesson contains 52 interactive pages as well as lots of differentiated activities. An
Subjects:
Grades:
1st - 2nd
CCSS:
Also included in: Data and Graphing Activities and Worksheets for First Grade
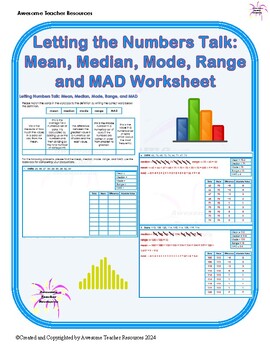
Letting Numbers Talk: Mean, Median, Mode, Range, and MAD Worksheet
The packet starts with suggestions for reinforcing and enriching learning related to data. This worksheet begins with the definitions of mean, median, mode, range, and MAD. Students are to write the correct word under the matching definition. Then students are given a data set. They are to find the mean, median, mode, range, and MAD. There is a substantial amount of space provided for students to complete their calculations. There is an answer key.
Subjects:
Grades:
5th - 8th
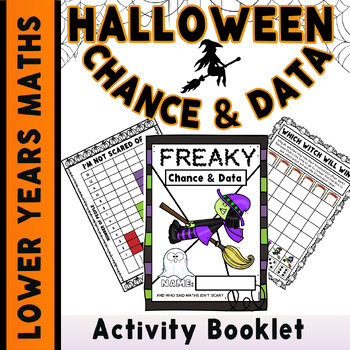
Halloween Maths Activity Booklet Lower Years Data & Chance Maths Activities
A booklet created for the lower years to complete full of freaky and fun maths activities that are Halloween themed and feel more like fun games to complete than learning! No Prep Required - Just Print and Go! Black and White or Color Options Available Complete over one day (whilst recovering from the candy high) or over the week of Halloween to celebrate! Activities Included in BookletData Activities Reading TalliesCounting Tallies Recording using Tallies Mixing and Matching Tallies to Numerals
Subjects:
Grades:
K - 2nd
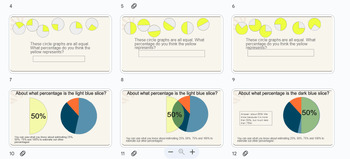
Estimating Percentages 2: Circle Graphs POWERPOINT
This mathematics PowerPoint resource is intended to support learners working on Virginia Standard of Learning:6.NS.1 a)Estimate and determine the percent represented by a given model (e.g., number line, picture, verbal description), including percents greater than 100% and less than 1%. This material was development for 1:1 review and tutoring. Teachers may find it useful for younger learners and students receiving special/exceptional education as well as with students learning in states other t
Subjects:
Grades:
4th - 6th
Math- Baseball: A Game of Numbers
In this Exploration, students will examine the statistics of four baseball players. The focus is to understand how the data is calculated. This classic American sport has always used math to keep track of everything that happens in the game. This math Exploration includes detailed, student-friendly Steps to Success that lead the learner through the process of creating a high-level, quality independent project. To add rigor and thoughtfulness, students reflect on their Exploration by answering s
Subjects:
Grades:
3rd - 8th
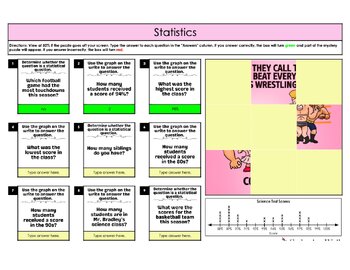
Math Mystery Puzzle: Introduction to Statistics
This self-correcting mystery puzzle is in Google Sheets. As students enter the correct answers the picture reveals itself. Box is red if the answer is wrong and green if the answer is correct - along with a puzzle piece reveal.This puzzle is an extension to Ch 9: Statistical Measures, Notes and Homework; Section 9.1: Introduction to Statistics and Ch 9: Statistical Measures, Skill Check*Fun and engaging*Great for review*Self-correcting*Thank you LindsayBowden.com for the template!*You May Also B
Subjects:
Grades:
5th - 7th
Types:
Also included in: Math Mystery Puzzles: Statistical Measures
Showing 1-24 of 85 results


