117 results
Elementary statistics graphic organizers
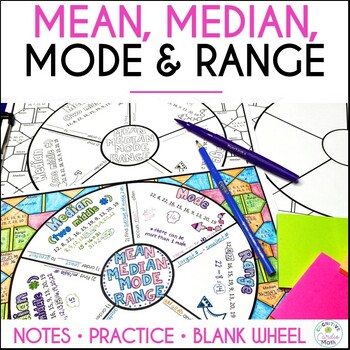
Mean, Median, Mode, Range Math Doodle Wheel | Notes and Practice Activity
Use this mean, median, mode, range doodle math wheel for notes and practice. Introduce each data measurement type as you teach it, or, you can use the math wheel to review all of them at once.What is a math wheel? A math wheel is a type of graphic organizer where students can:Take notes/guided notes inside the math wheelUse color, drawing, and doodling to help create memory triggersComplete practice problems in the pattern around the wheel, andColor the background patternStudents can keep these
Subjects:
Grades:
4th - 6th
Also included in: Mean, Median, Mode, Range Activity Bundle Math Centers
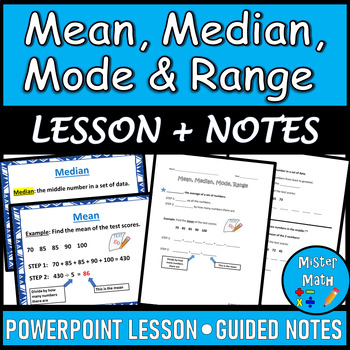
Mean, Median, Mode & Range PPT and Guided Notes BUNDLE
This Mean, Median, Mode & Range BUNDLE includes a PowerPoint Lesson and a corresponding Guided Notes Packet to assist students in learning about finding the mean, median, mode, and range of data sets. The PowerPoint and Guided Notes packet include key vocabulary, as well as an example for each skill. Additional practice problems are included that ask students to find the mean, median, mode and range of four data sets (for a total of 16 extra practice problems!) The presentation also comes fu
Subjects:
Grades:
3rd - 6th
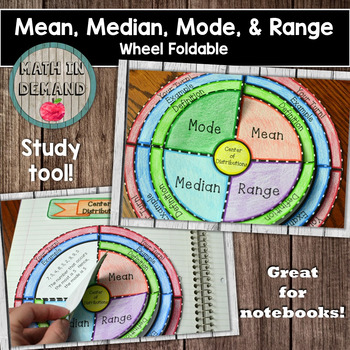
Mean, Median, Mode, and Range Wheel Foldable (Center of Distributions)
Students will construct a foldable on mean, median, mode, and range. There are 4 layers for the foldable: (1) Title, (2) Definition, (3) Example, and (4) Your Turn!. There is also a blank template included.
CLICK HERE to see my math foldables bundle!
CLICK HERE TO CHECK OUT MY VIDEO ON THIS FOLDABLE!
Subjects:
Grades:
5th - 9th
Also included in: Math Foldables Bundle (Includes All Math Wheel Foldables)
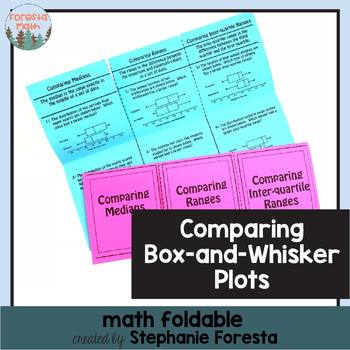
Comparing Box-and-Whisker Plots Math Foldables
A fun foldable to teach or review comparing medians, ranges, and inter-quartile ranges of two box-and-whisker plots.
Subjects:
Grades:
5th - 10th
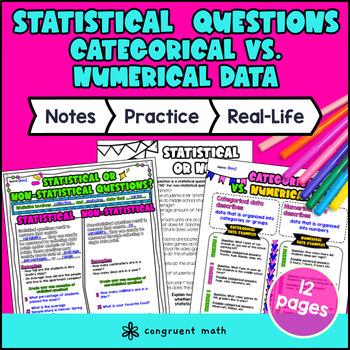
Statistical Questions Guided Notes | Categorical and Numerical Data
Introduce the statistical questions vs. non statistical questions, categorical data, and numerical data with this 12-page packet of self-contained lessons for your 6th grade math students! It includes guided notes with doodles (sketch notes) to introduce the new vocabularies, a color-by-number activity, an in-class practice problems sheet, and a real-life application. This lesson works well as a formal lesson, graphic organizer, scaffolded notes, or interactive notebooks for the statistics unit
Subjects:
Grades:
5th - 6th
CCSS:
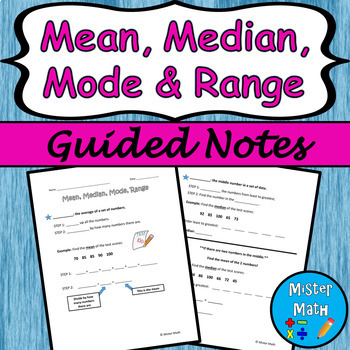
Mean, Median, Mode & Range Guided Notes
This is a guided notes resource to assist students in learning about finding the mean, median, mode, and range of data sets. The guided notes include definitions, as well as a guided example for each skill. An independent practice worksheet is included that asks students to find the mean, median, mode and range for four data sets (for a total of 16 extra practice problems!) An answer key is also provided.This Guided Notes packet is also part of a BUNDLE that includes a PowerPoint presentation to
Subjects:
Grades:
3rd - 6th
Also included in: Mean, Median, Mode & Range PPT and Guided Notes BUNDLE
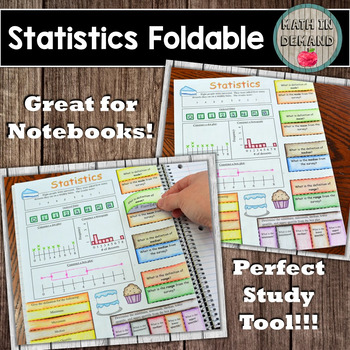
Statistics Foldable
Included is a foldable on statistics: mode, mean, median, range, minimum, maximum, upper quartile, and lower quartile. This is a great activity for any grade learning about statistics especially 6th and 7th grade. Students will love creating these foldables and it gives them a great tool to use to study!
Students will create a foldable then answer questions on the foldable. Students will construct a dot plot, histogram, and box plot. In addition, students will be giving the definitions and
Subjects:
Grades:
5th - 8th
Also included in: Math Foldables Bundle (Includes All Math Wheel Foldables)
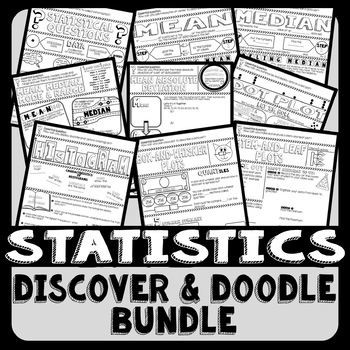
Statistics Discover & Doodle Bundle
Looking for engaging notes that maximize class time and retention? Discover & Doodle pages are research based and combine words with visuals that boost student recall of information. They help students see what is important and visualize mathematical connections. Print full size for a binder, folder or handout. Need smaller size note pages to glue into a notebook? Follow the printing directions included to scale the pages down to notebook size.Each Discover & Doodle Topic Includes⇒
Subjects:
Grades:
5th - 7th
How to Find an Average or Mean
Need a simple, scripted lesson to help you teach how to find an average?
This is a 20 page PDF file that includes:
Anchor Chart Materials,
1 worksheet for independent practice (Only one because you have a ton of those, right?)
Scripted lesson plans...it starts with the simplest examples that kids understand. Our district math coach helped with that ;)
Printables for your interactive notebooks (Or these can be used as exit slips!)
Thanks for stopping by Classy Gal Designs and Publishi
Subjects:
Grades:
4th - 6th
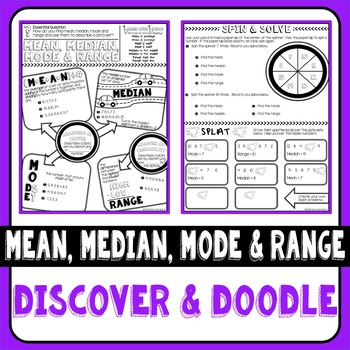
Mean, Median, Mode and Range Discover & Doodle
Looking for engaging notes that maximize class time and retention? Discover & Doodle pages are research based and combine words with visuals that boost student recall of information. They help students see what is important and visualize mathematical connections. Print full size for a binder, folder or handout. Need smaller size note pages to glue into a notebook? Follow the printing directions included to scale the pages down to notebook size.Discover & Doodle Pages Include⇒ Printi
Subjects:
Grades:
4th - 6th
Also included in: Statistics Discover & Doodle Bundle
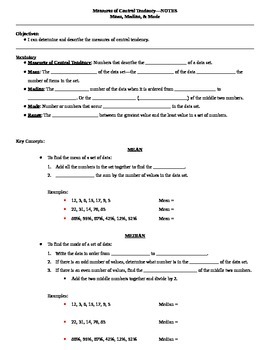
Measures of Central Tendency Guided Notes
These are guided notes for a lesson on measures of central tendency including mean, median, mode, and range. There are several examples in the notes and the same data sets are used to show each measure of central tendency.I have also included a teacher key to show you what to fill in the blanks as your students follow along.To use these notes, I simply projected them onto my whiteboard, gave the students their blank copies, and had them follow along and write what I wrote. This works great when
Subjects:
Grades:
5th - 12th
CCSS:
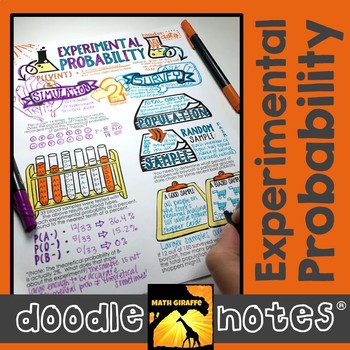
Experimental Probability Doodle Notes
experimental probability: simulations, surveys, samples, etc. - visual interactive "doodle note" When students color or doodle in math class, it activates both hemispheres of the brain at the same time. There are proven benefits of this cross-lateral brain activity:- new learning- relaxation (less math anxiety)- visual connections- better memory & retention of the content!Students fill in the sheets, answer the questions, and color, doodle or embellish. Then, they can use it as a study gui
Subjects:
Grades:
5th - 7th
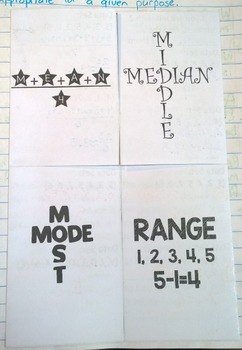
Measures of Central Tendency Foldable Notes SOL(2016) 5.17
This file is a multi-door foldable for Measures of Central Tendency. It can be used stand-alone or in a notebook. The inside on the foldable is fill-in-the-blank notes about Mean, Median, Mode, and Range and examples for each. Detailed instructions are included. All files are PDFs.
This product is for use for a single-classroom/teacher. Additional licenses are available at a discount for use by multiple classrooms/teachers.
Please remember to rate this product from Magnificent Marvelous Middle
Subjects:
Grades:
5th - 7th

Foldable- Line Plot, Bar Graph, Box-and-Whisker Plot, and Circle Graph
This foldable includes examples of four different graphs. The graphs included are the line plot, bar graph, box-and-whisker plot, and circle graph. There is a fill in the blank definition and an area devoted to brief practice of the analyzing of these graphs. Answer Key included.
Subjects:
Grades:
4th - 8th
Graphs and Data Interactive Notebook Lessons {6.SP and 7.SP}
Looking for step by step instructions for interactive notebooking using data and graphs? This file is exactly what you need! There are complete instructions for notebook organization and how students use a self assessment stop light graphic organizer to communicate their comprehension of the lesson. For each lesson, there are complete instructions, student foldables to make the entries completely interactive, and pictures of sample pages. Each lesson also contains data to use with the foldables.
Subjects:
Grades:
4th - 7th
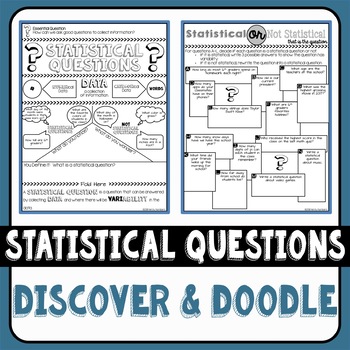
Statistical Questions Discover & Doodle
Looking for engaging notes that maximize class time and retention? Discover & Doodle pages are research based and combine words with visuals that boost student recall of information. They help students see what is important and visualize mathematical connections. Print full size for a binder, folder or handout. Need smaller size note pages to glue into a notebook? Follow the printing directions included to scale the pages down to notebook size.Discover & Doodle Pages Include⇒ Printi
Subjects:
Grades:
5th - 7th
CCSS:
Also included in: Statistics Discover & Doodle Bundle
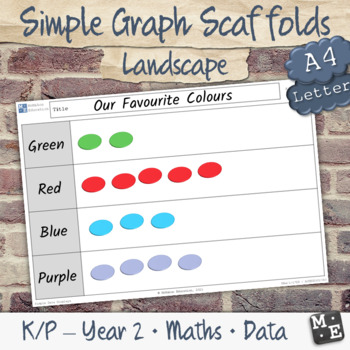
GRAPHING DATA Simple Picture Column Bar Graph Blank Scaffolds (Landscape)
Introduce students to arranging and representing data in rows or columns, with these printable graph scaffolds.By using these scaffolds students will:Use concrete materials, pictures or drawings as symbols to create data displays with one-to-one correspondenceGroup objects according to certain characteristicsArrange objects in rows or columns to form data displaysInterpret information presented on each data displayThis resource contains blank, A4/letter size scaffolds in landscape orientations:2
Subjects:
Grades:
K - 2nd
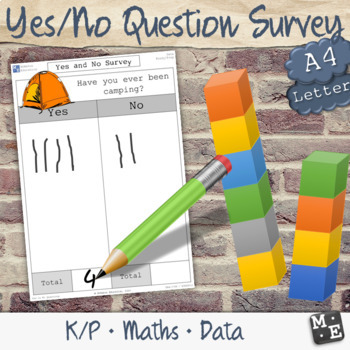
COLLECTING DATA Yes and No Survey Questions Worksheets
Get your students up and about as they conduct simple Yes and No surveys, gather and record factual data to build a source of information about the themselves and others in their immediate environment. These printable worksheets will provide a suitable scaffold with interesting and fun questions, that will prompt interpretive discussion about the similarities and differences between peer personalities and traits.By using these worksheets, students will collect information about themselves and th
Subjects:
Grades:
K
Choosing the Best Measure of Center
NO PREP LESSON!These amazing guided notes will help your students on all ability levels build on their understanding of mean, median, and mode. This is an extension lesson to apply mean, median, and mode to a real-world situation.Included sections are vocabulary, an activity, steps to solve, and examples including word problems. An answer key is included.This guided note will take approximately 45 minutes to teach.
Subjects:
Grades:
5th - 8th
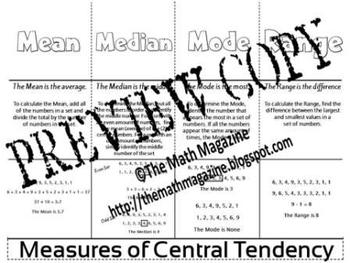
Measures of Central Tendency Mean Median Mode Foldable 6.SP.A.1, 7.SP.1, S-ID.2
Measures of Central Tendency Mean Median Mode Foldable 6.SP.A.1-3, 7.SP.1-4, S-ID.2
This is a single page PDF foldable that explains the Measures of Central Tendency: Mean, Median, Mode and Range.
The foldable includes: the definition of each term, an explanation of the correct ways to determine each and an example of each.
The folding directions are included with the purchased file.
BONUS: (2) FREE ITEMS are included as my way of thanking you for your interest in my items.
Follow me on T
Grades:
5th - 12th, Adult Education
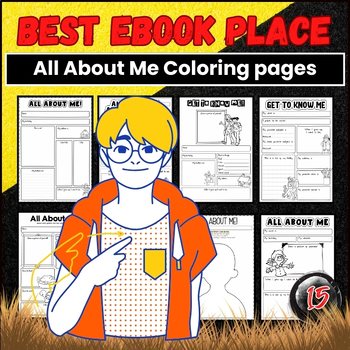
All About Me and My Family Coloring Pages Worksheets
Introducing our engaging and interactive All About Me Coloring Pages Worksheets, designed to captivate young learners and encourage self-expression. These worksheets are perfect for children aged 3-8 years old, allowing them to explore their interests, emotions, and personal characteristics through fun coloring activities. Table : All About Me Printable Sheet All About Me Worksheet All About Me Worksheets All About Me Coloring Pages All About Me Activity Worksheets All About Me
Subjects:
Grades:
PreK - 6th
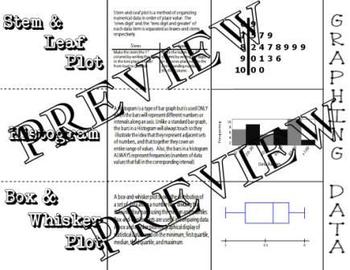
Graphing Data Histogram Box Whisker Stem Leaf Plot Foldable Interactive Notebook
Graphing Data Histogram Box Whisker Stem Leaf Plot Foldable Interactive Notebook
This is a single page PDF foldable that explains the differences in Histograms, Box and Whisker Plots and Stem and Leaf Plots, as well as shows an example of each.
The folding directions are included.
All feedback is welcomed
Follow Me on TpT!
Subjects:
Grades:
4th - 12th, Adult Education
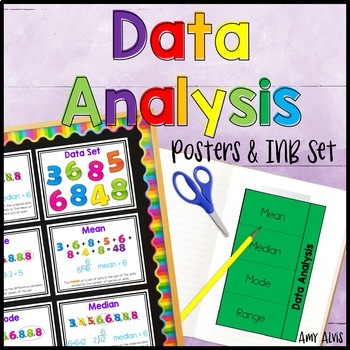
Data Analysis Posters and Graphic Organizer INB Set Anchor Chart
This poster and interactive notebook (INB) set covers data set, mean, median, mode and range. This set includes a ONE interactive foldable graphic organizer (INB), FIVE posters (8.5 X 11) and THREE versions of the data set cards.The posters and data cards come in a color version as well as a black and white version.Thank you for looking,Amy Alvis
Subjects:
Grades:
4th - 6th
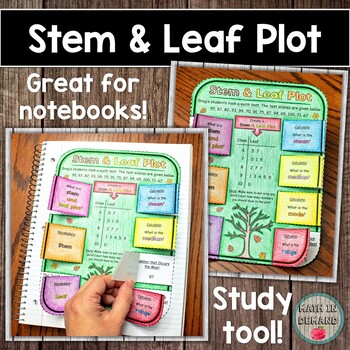
Stem and Leaf Plot Foldable
Included is a foldable on stem & leaf plots. Students can use the foldable to help them study for a test. This is a great hands on activity for any grade level learning about stem and leaf plots.Students will be given some data. They will need to organize the data and create a stem & leaf plot. They will determine the mean, median, mode, and range of the given data.There are 2 versions: (1) Fill-In and (2) Already Filled-In. You can decide to use whichever version you prefer.
Subjects:
Grades:
5th - 7th
Also included in: Math Foldables Bundle (Includes All Math Wheel Foldables)
Showing 1-24 of 117 results


