243 results
Elementary statistics projects
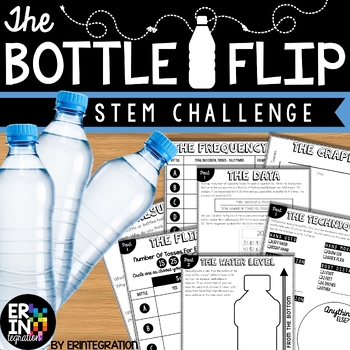
Water Bottle Flip STEM Challenge + STEM Activity
The ORIGINAL water bottle flip STEM activity and lab! Water bottle flip at school? Absolutely! Students will love this on-trend STEM challenge inspired by the popular YouTube water bottle flipping challenge where students toss a water bottle and attempt to land it straight up. Practice scientific method with some probability, fractions and data collection in the mix while having fun!This self-paced, low-prep, project based learning water bottle flip STEM challenge is print-and-go. Each activit
Subjects:
Grades:
3rd - 6th
Types:
CCSS:
NGSS:
K-2-ETS1-2
, K-2-ETS1-3
, MS-ETS1-2
, K-2-ETS1-1
, 3-5-ETS1-3
...
6th Grade Statistics Project: Analyzing Zombie Virus with Dot Plots and Mean
I created this project as a way for my 6th graders to practice their statistical skills. They loved it! They get to pretend to be epidemiologists studying a virus outbreak that is turning people into zombies. It's a fantastic way for students to see how statistics is used in the "real world" - they were also very interested to learn about the field of epidemiology. The Project: Students are given data about infected people who are quarantined in an airport. They are also given two maps of the US
Subjects:
Grades:
5th - 7th
Types:
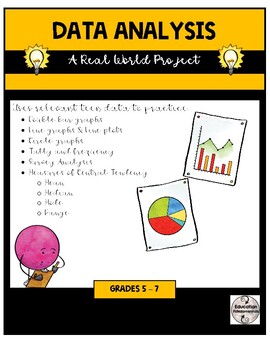
Data Analysis - Real World Project
**Now updated for distance learning!**This teaching package contains everything you need to make data analysis relevant to your teen or pre-teen student! Carefully crafted activities use real-life data from your class as well as generic, yet realistic, data from a fictitious group of teens.Activities require rigorous application of mathematical skills. Concepts covered include:• Measures of central tendency – mean, median, mode & range• Line plots• Tally & frequency• Double bar graphs•
Subjects:
Grades:
4th - 7th
Types:
Also included in: Data Analysis Teaching Bundle
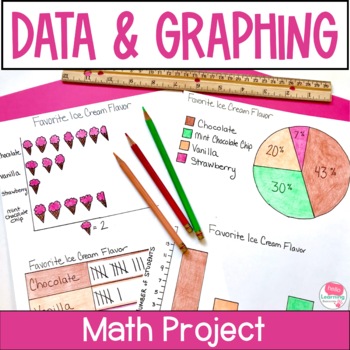
Data and Graphing Project - Real World Math Project Based Learning Activities
This data and graphing project gives your students a meaningful way to apply their data and graphing skills. Use this real world math project as an end of unit activity, enrichment activity or assessment. Easy to use and fun for students!Click the PREVIEW button above to see everything that is included in this fun math project!⭐ This resource includes:teacher information, directions and sample schedulesupply listgrading rubricstudent direction sheettwo data collection sheets (one for open ended
Subjects:
Grades:
4th - 6th
Types:
CCSS:
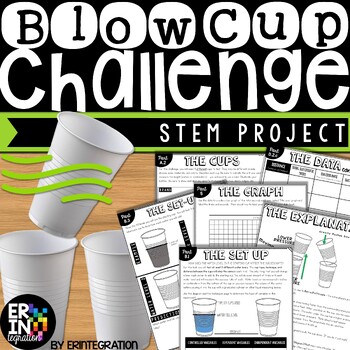
Blow Cup STEM Challenge and Scientific Method Project
The Blow Cup Challenge is now a STEM activity with this engaging science project inspired by the viral video where students try to blow one cup into another cup. Great low-prep way to teach the scientific method, variables and review math skills!This self-paced, multi-part Blow Cup STEM challenge is print-and-go. Each activity sheet guides students through the project. STEM Challenge Overview:Students will use the included visual directions, graphic organizers, charts, and activities to...Deter
Subjects:
Grades:
3rd - 6th
Types:
NGSS:
MS-PS2-2
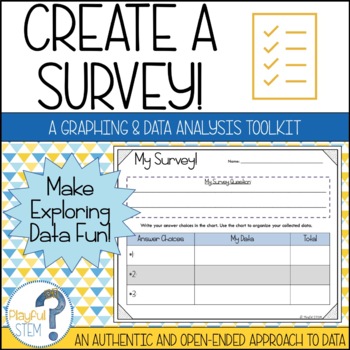
Create Your Own Survey: Collect, Organize, Graph, and Analyze Data
One of my best-selling TPT products -- now updated with a fresh look and new content!Teach Data Analysis the open-ended and engaging way -- through student-directed surveys!This resource pack is designed to help students follow the process of creating a survey: they will brainstorm questions, collect data, organize their obtained data, create multiple graphs to show their data, and then reflect on and analyze what their data tells them.The survey pack includes the following:Brainstorming Survey
Subjects:
Grades:
2nd - 5th
Types:
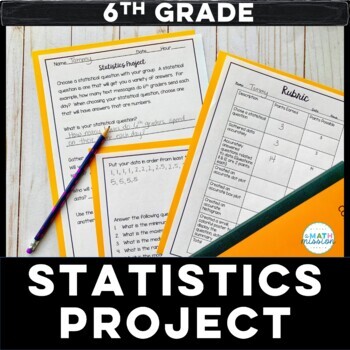
Math Statistics Project Based Learning Dot Plot Box Plot Histogram
Set your students loose to practice their statistics skills! This project is great for a culminating assessment. This project is centered around students coming up with a statistical question, and gathering data on that question. Students answer statistical questions, and create a dot plot, box and whisker plot and histogram based on the data collected. A summary of their findings is then created to display for others to see. A rubric is included for grading purposes. This project actively
Subjects:
Grades:
5th - 7th
Types:
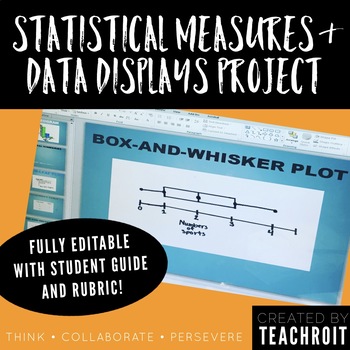
Statistics & Data Display Project for 6th Grade Math PBL (Fully Editable)
This product includes a student guide for a 6th grade middle school mathematics project that will require students to develop a statistical question, conduct a survey with their classmates, create numerical summaries, represent their findings using visual data displays, and finally present their findings! The thorough student guide provides step by step directions for each part of the project and could be used as either an in class project or to be assigned as homework. The student guide also in
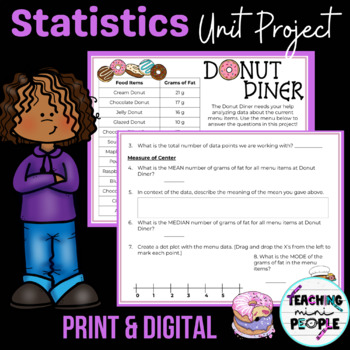
Statistics Project | 6th Grade Math Activity | Editable
This EDITABLE Statistics Unit Project is perfect for reviewing the unit with one set of data. Students use a donut shop menu to analyze grams of fat data. Students practice with histograms and dot plots, measures of center, measures of spread, and the shape of distribution. **This product has been updated to add an EDITABLE print version! You can now edit the numbers as well as the questions asked about the data. Included: ➜ Teacher directions➜ Print Version for Students➜ Digital Version for Stu
Subjects:
Grades:
5th - 7th
Types:
Also included in: 6th Grade Statistics | Measure of Center | Box Plots | 5 Number Summary
Mean, Median, Mode, and Range (Bundled Unit) - Distance Learning
This is an enjoyable, interactive, and engaging bundled unit covering mean, median, mode, and range (and introduces outliers). This unit is great for 5th and 6th graders and 7th graders who struggle with these concepts.Included in this bundled unit:PowerPointAnimated and fun 4-part, 21-slide PowerPoint (multi-day use)-Part 1 – The Meaning of Mean-Part 2 – Getting in the Middle of Median-Part 3 – Making the Most of Mode-Part 4 – Home, Home on the RangeEach section offers plenty of practice probl
Subjects:
Grades:
5th - 7th
Geometry: Survey and Circle Graph Project Made Fun!
Circle Graph Geometry Activity - Everyone just wants their piece of the pie!This is a fun, multi-faceted project that will have your students creating and implementing a survey, converting their results using various mathematical operations, and creating a poster-sized circle graph incorporating various geometry skills.This Survey and Circle Graph Project Unit Includes:PowerPoint:-Fun, interactive, 3-part PowerPoint slide presentation that walks you and your students through the entire project f
Subjects:
Grades:
5th - 7th
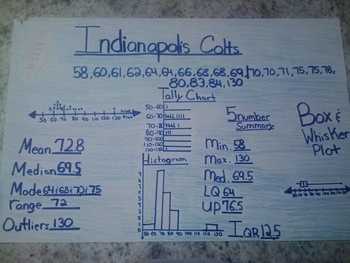
Favorite Sports Team: Data Displays and Measures of Central Tendency Project
Students will create a poster using sports statistics. Depending on the time of year, you may want to use football scores, basketball scores, data from the Olympics, etc. Students will use the internet (or you can print out statistics for them) to find sports data.
The students really buy into this project because it is about something they are interested in - their favorite sports team!
Students will display their knowledge of several data displays: line plot, tally chart, histogram and bo
Subjects:
Grades:
5th - 8th
Types:
Probability Carnival
**FULL Preview Available!**
Time for a carnival! In this probability project, students are asked to create a game of chance for a class carnival. Students will need to write directions for their game. They will also need to decide if the game is fair or unfair and explain why. Finally, the students are asked to list several possible outcomes of the game and give the probability of each outcome as a fraction and using the words likely, unlikely, certain or impossible.
This product includes:
A
Subjects:
Grades:
3rd - 6th
Types:
Data and Graphs Projects, 5th and 6th Grade Math Enrichment
Fun Data and Graph Enrichment Projects Students Love! Nine fun math projects that range from finding distances from cities to Olympic records and even charting calories on a super sized cheeseburger. The fun and creative projects utilize line plots, line graphs, bar graphs, double bar graphs, pie/circle graphs, mode, median, mean and range. I've also included a set of vocabulary terms, sample graphs and and a rubric! Print and go math enrichment! Perfect for distance learning as well.Please che
Subjects:
Grades:
4th - 6th
Types:
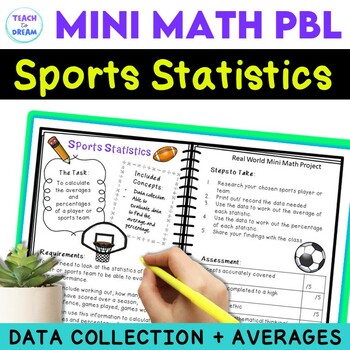
Inquiry Based Math Project | Data and Averages | Sports Statistics Grade 6th 7th
This Inquiry Based Math Project with the theme SPORTS STATISTICS, investigates percentages, averages and data. Students will be engaged and enjoy using numeracy in a real life situation. It has been designed for students in grades 4 to 7. Now suitable for in person and online learning with printable PDF and online Google slides.THE PERFECT WAY TO GET STUDENTS INTERESTED IN MATH!The projects are easy to follow and can either be teacher run or student driven. Each math project is designed to run b
Subjects:
Grades:
4th - 7th
Types:
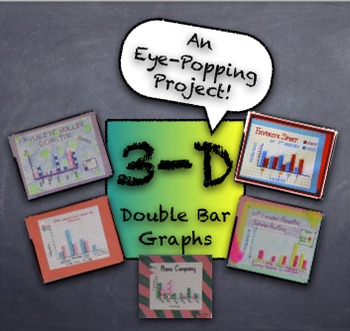
3-D Double Bar Graphs PROJECT from Student Generated Survey Data - Fun Project
This project creates quite an impressive product with simple supplies easily accessible in any classroom. Students generate data from surveys given to peers, using simple questions like, "What's your favorite pizza topping?" Students use survey results to create a 3-dimensional "girls versus boys" double-bar graph. Using centimeter graph paper, markers, and glue sticks, the double-bar graph projects are truly eye-popping! Project description, survey information, and graph assembly instructio
Subjects:
Grades:
3rd - 12th, Adult Education
Types:
Water Bottle Flipping Investigation
Water bottle flipping- ratio, percent, measurement, data collection and graphing! The kids love bottle flipping and this product will let you bring bottle flipping into your classroom in an educational way!
Students will make predictions about the ideal water level in their water bottle that will result int he most successful flips. They will then record data about their bottle and conduct a variety of trials using different water levels to test their success with flipping their bottle at d
Subjects:
Grades:
5th - 7th
Types:
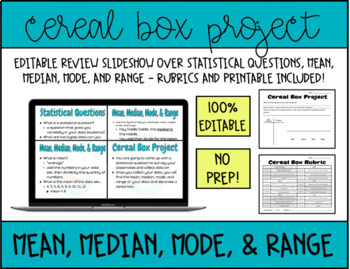
Mean, Median, Mode, and Range Cereal Box Project | Editable - Distance Learning
This project is a great way to teach and/or review mean, median, mode, range, and statistical questions. This slideshow is editable and comes with a work page and rubric for students to complete their project. Each slide presents in sequence for easy review.Students will come up with a statistical question and collect data by surveying the class. They will use their data to fill out a frequency table, line plot, then find the mean, median, mode, and range of their data. Then, they will creat
Subjects:
Grades:
5th - 7th
Types:
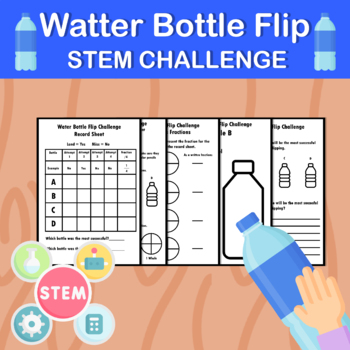
Water Bottle Flip STEM Challenge / Back to school
Water Bottle Flip STEM ChallengeStudents will love this water bottle flip challenge. This experiment is fun for the whole class! Students will predict which water bottle will land perfectly according to the water level. They will test their hypothesis by flipping the different water bottles and record their findings on their record sheet. They will then convert their recordings into fractions.This water bottle challenge includes a bullseye in which students can compete against one another to see
Subjects:
Grades:
4th - 7th
Types:
Also included in: STEM Bundle / 5 STEM challenges
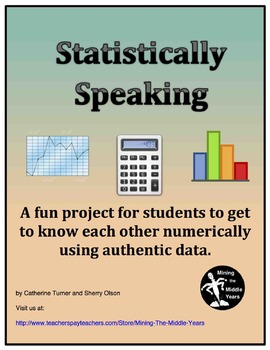
Statistics Projects: Collecting Authentic Data for Graphing and Analysis
Engage your students in Statistics. Students generate their own statistical question and then collect authentic data to graph, calculate and reflect upon the results. This is a great activity for a Back to School Project! It works well as a stand-alone Statistics project anytime during the year. This project aligns well to Common Core Standards for Math. Included in this package are:-measures of center (mean, median, mode)-range-bar and line graphing-data collections -reflective questions f
Subjects:
Grades:
5th - 9th
Types:
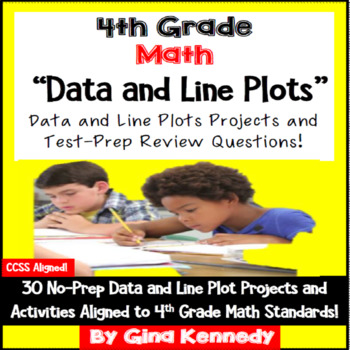
4th Grade Data & Line Plots, 30 Enrichment Projects and 30 Test-Prep Problems
No-prep, 4th Grade data and line plots practice with 30 enrichment projects and 30 review test-prep questions aligned to the standards. Great for teaching the important data standards in a fun, engaging way. Excellent for early finishers, advanced math students or whole class practice. Print and go math enrichment! These work perfectly for distance learning as well.This resource includes thirty 4th Grade Common Core data and line plots problem solving test-prep questions and 30 no-prep data and
Subjects:
Grades:
4th
CCSS:
Also included in: 4th Grade Math Projects For Every Standard! Enrichment All-Year Bundle!
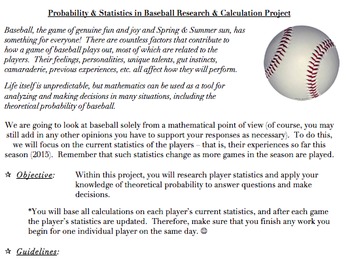
Probability & Statistics in Baseball Project (Common Core Aligned, AND FUN!)
The problems and activities within this document are designed to assist students in achieving the following standards: 6.SP.B.5, 7.SP.C, HSS.CP.A.2, HSS.CP.A.3, HSS.CP.B.7, HSS.CP.B.9, as well as the standards for mathematics practice and the literacy standards. They are also designed to help the teacher assess the students’ abilities when it comes to working with the ideas within the standards.This document contains the following:A project designed to allow students to investigate theoretical
Subjects:
Grades:
5th - 12th, Higher Education, Adult Education, Staff
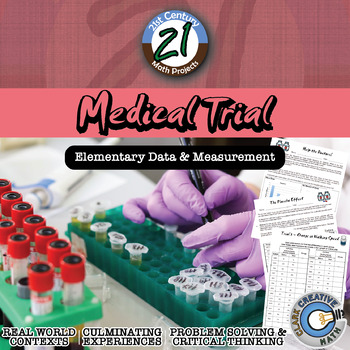
Medical Trial -- Elementary Data Edition - Medical - 21st Century Math Project
Bring your students into the world of double blind medical studies. Every day, doctors and hospitals rely on scientific studies and research to make healthcare decisions for patients. Are some medicines more effective than others? Do certain types of patients benefit more from certain types of treatments? Due to the security of medical records, studies are somewhat limited in their scope and are generally carried out at universities and research hospitals. At these facilities ground breaking wo
Subjects:
Grades:
3rd - 5th
Types:
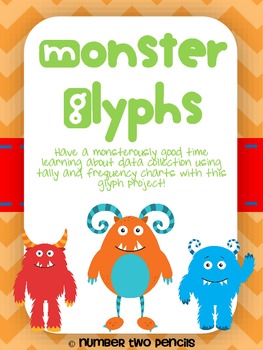
Monster Glyph and Graph
In this monster glyph activity students create a unique glyph while teaching classmates about themselves. Students then use the class glyph to collect and analyze data, creating their own graphs as displays. This project is especially great because its complexity can be easily differentiated across grades and customized for the individual needs of your students.
This work is licensed under a Creative Commons Attribution-NonCommercial-NoDerivs 3.0 Unported License.
Subjects:
Grades:
1st - 4th
Types:
Showing 1-24 of 243 results


