705 results
Elementary statistics assessments
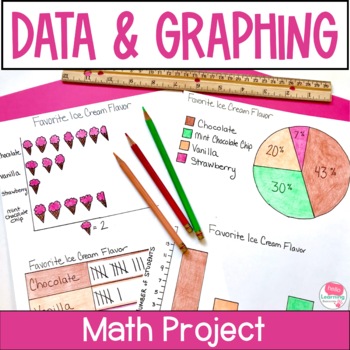
Data and Graphing Project - Real World Math Project Based Learning Activities
This data and graphing project gives your students a meaningful way to apply their data and graphing skills. Use this real world math project as an end of unit activity, enrichment activity or assessment. Easy to use and fun for students!Click the PREVIEW button above to see everything that is included in this fun math project!⭐ This resource includes:teacher information, directions and sample schedulesupply listgrading rubricstudent direction sheettwo data collection sheets (one for open ended
Subjects:
Grades:
4th - 6th
Types:
CCSS:
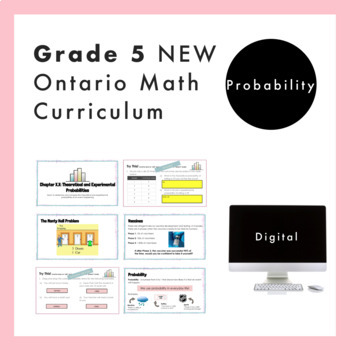
Grade 5 Ontario Math - Probability Curriculum - Digital Google Slides+Form
Are you planning for the NEW Grade 5 Ontario Math Curriculum? This fully editable, NO PREP Google Slide resource is what you need! This resource is for the DATA strand and covers all specific expectations for “D2. Probability”. In this resource, students will experience math through engaging real-life questions, storytelling through math, and interactive slides. For teachers who are given Nelson© Math by your board, this resource loosely follows the order of the Probability chapter (Chapter 13)
Subjects:
Grades:
4th - 6th
Also included in: Grade 5 NEW Ontario Math Curriculum Full Year Digital Slides Bundle
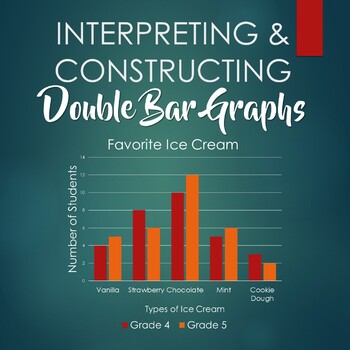
Interpreting and Constructing Double Bar Graphs - Booklet
This booklet includes six worksheets:- 3 double bar graphs for students to interpret- 3 sets of data for students to construct double bar graphs, with corresponding questions- answer key
Subjects:
Grades:
3rd - 6th
Types:
Year 1 Australian Curriculum Maths Assessment BUNDLE OF ALL STRANDS
This pack contains maths assessment pages directly linking each of the content descriptions and the achievement standard of the Year 1 Australian Curriculum for Mathematics.
There are 2 assessment pages for each content description with matching standard statements for;
Number and Algebra Strand
Measurement and Geometry Strand
Statistics and Probability Strand
The assessments are designed to be used before and after teaching a unit covering this content.
Answer pages are included for ease of
Subjects:
Grades:
1st - 2nd
Types:
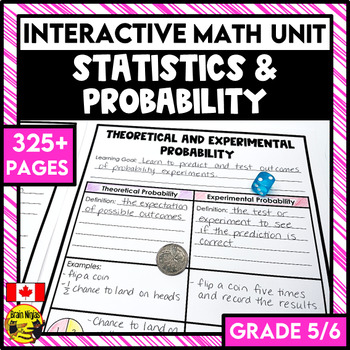
Statistics Graphing and Probability Interactive Math Unit | Grade 5 and Grade 6
Stop searching for your statistics and probability lessons. Everything you need to teach, practice, and assess double bar graphs, line graphs, stem and leaf plots, and probability is included in this print-and-use unit. Your planning for your graphing and probability unit is already done for you!This unit is part of the Full Year Interactive Math Unit Bundle for Grade 5/6. It comes with a bonus sequencing guide to help plan your whole year.This all-inclusive resource includes:instructions for ho
Subjects:
Grades:
5th - 6th
Grade 5 NEW Ontario Math Data Literacy Unit Digital Slides
This resource includes a comprehensive and engaging Grade 5 Ontario Math Data Literacy Unit including 3-part lessons, skill practice, self-grading assessment, and social emotional learning. This unit covers EVERY SPECIFIC Expectation from the 2020 Ontario D1. Data Literacy Strand. WHY BUY THIS PRODUCT OVER OTHERS?My vision for teaching math is always "Don't just tell the story, let the students experience the story first hand. HOW?Students will be walked through curriculum concepts step-by-step
Subjects:
Grades:
4th - 6th
Types:
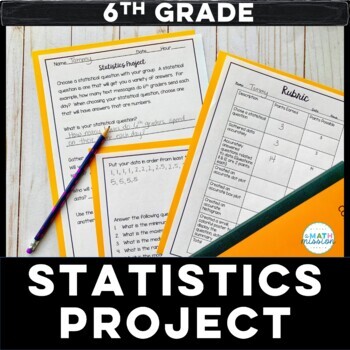
Math Statistics Project Based Learning Dot Plot Box Plot Histogram
Set your students loose to practice their statistics skills! This project is great for a culminating assessment. This project is centered around students coming up with a statistical question, and gathering data on that question. Students answer statistical questions, and create a dot plot, box and whisker plot and histogram based on the data collected. A summary of their findings is then created to display for others to see. A rubric is included for grading purposes. This project actively
Subjects:
Grades:
5th - 7th
Types:
Year 2 Australian Curriculum Maths Assessment BUNDLE OF ALL STRANDS
This pack contains maths assessment pages directly linking each of the content descriptions and the achievement standard of the Year 2 Australian Curriculum for Mathematics.
There are 2 assessment pages for each content description with matching standard statements for;
Number and Algebra Strand
Measurement and Geometry Strand
Statistics and Probability Strand
The assessments are designed to be used before and after teaching a unit covering this content.
Answer pages are included for ease of
Subjects:
Grades:
1st - 3rd
Types:
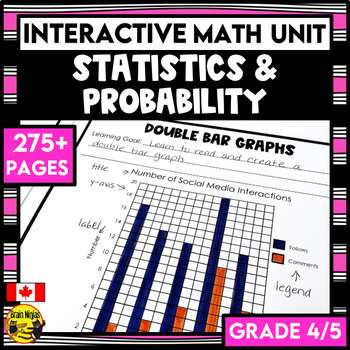
Statistics Graphing and Probability Interactive Math Unit | Grade 4/5
Stop searching for your statistics and graphing lessons. Everything you need to teach, practice, and assess bar graphs, pictographs, double graphs, stem and leaf plots and probability is included in this print-and-use unit. Your planning for your graphing unit is already done for you!This unit is part of the Full Year Interactive Math Unit Bundle for Grade 4/5. It comes with a bonus sequencing guide to help plan your whole year.This convenient resource includes:instructions for how to set up, as
Subjects:
Grades:
3rd - 5th
Analyzing Plots, Graphs, and Tables using Measures of Central Tendency
This product provides students the opportunity to analyze data presented in different ways. By making calculations and analyzing data, students make conjectures and justify them using mathematical reasoning and evidence!What is included?This product contains 8 student work pages. Each work page contains a set of data displayed graphically with accompanying questions. The data displays included are 2 dot plots, 2 bar graphs, 2 frequency tables, and 2 stem-and-leaf plots. Students are required
Subjects:
Grades:
5th - 11th
Types:
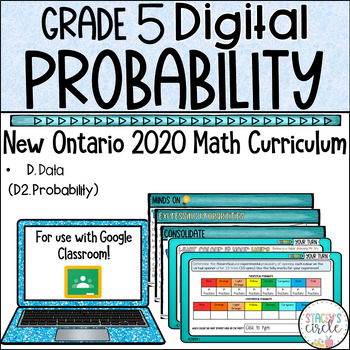
Grade 5 Probability 2020 Ontario Math Digital Googles Slides : D . Data
This resource includes a comprehensive Grade 5 Ontario Math Probability curriculum unit including lessons, activities, assessment and social emotional learning skills.This unit covers EVERY SPECIFIC Expectation from the 2020 Ontario D2. Probability (D. Data) strand. WHY BUY THIS PRODUCT OVER OTHERS?My vision for teaching math is always "Don't just tell the story, let the students become part of the story".Students will be walked through curriculum concepts step-by-step in easy-to-understand lang
Subjects:
Grades:
4th - 6th
Types:
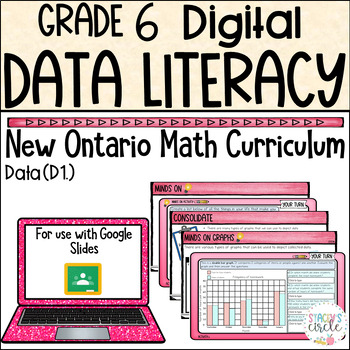
Grade 6 Data Literacy 2020 Ontario Math Digital Google Slides : D. Data
This resource includes a comprehensive and fully hands-on and interactive unit covering the entire Data Literacy strand from the Grade 6 New Ontario Math Curriculum. (D1.1-D1.6). WHY BUY THIS PRODUCT OVER OTHERS?My vision for teaching math is always "Don't just tell the story, let the students experience the story first hand. HOW?Students will be walked through curriculum concepts step-by-step in easy-to-understand language using identifiable and relatable problems.Rather than mostly instruction
Subjects:
Grades:
5th - 7th
Types:
Also included in: Grade 6 Ontario Math Curriculum FULL YEAR Digital Slides Platinum Bundle
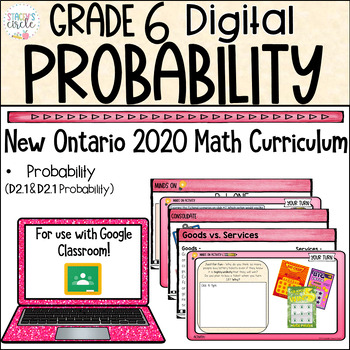
Grade 6 Ontario Math Probability Unit Digital Slides
Are you looking for an engaging and relatable way to teach your students concepts from the entire Grade 6 Ontario Math Probability strand? Your search ends here. WHY BUY THIS PRODUCT OVER OTHERS?My vision for teaching math is always "Don't just tell the story, let the students experience the story first hand. HOW?Students will be walked through curriculum concepts step-by-step in easy-to-understand language using identifiable and relatable problemsRather than mostly instructional slides, this pr
Subjects:
Grades:
5th - 7th
Types:
Also included in: Grade 6 Ontario Math Curriculum FULL YEAR Digital Slides Platinum Bundle
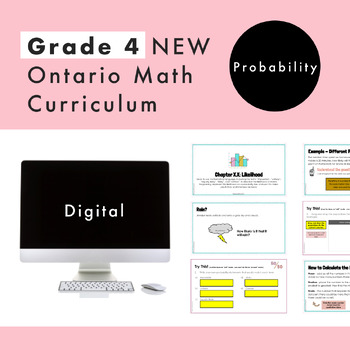
Grade 4 Ontario Math - Probability - Digital Google Slides + Form
Are you planning for the NEW Grade 4 Ontario Math Curriculum? This editable Google Slide and Google Form resource is what you need! This resource is for the DATA strand and and covers specific expectations for “D2. Probability”. In this resource, students will experience math through engaging real-life questions, storytelling through math, and interactive slides. What’s Included2 Google Slide presentations45 UNIQUE and EDITABLE Google Slides in totalSlides are editable for you to increase stud
Subjects:
Grades:
3rd - 5th
Types:
Also included in: Grade 4 NEW Ontario Math Curriculum Full Year Digital Slides Bundle
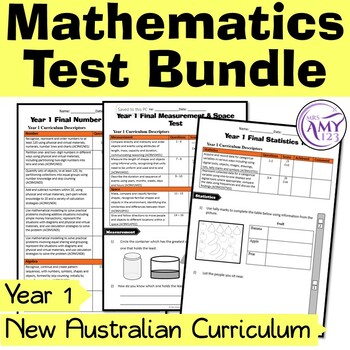
Year 1 Mathematics Test Bundle- Australian Curriculum
This is a bundle of 3 test packs that assess students achievement of the outcomes in Mathematics in the Australian Curriculum over the course of a year in Number & Algebra, Statistics & Probability and Measurement & Geometry. It contains three tests for each strand; initial, mid and final.✩The initial tests determines whether students have met the end of year requirements for Foundation given within the first weeks of the year. The mid tests checks to see the students progress on the
Subjects:
Grades:
1st
Types:
Examining Effects of Outliers on Measures of Central Tendency
This 10-page document contains 3 real-life data sets. For each data set, students are guided through an exploration of how outliers in data affect mean, median, mode, and range. Each data set requires students to perform calculations and analyze data. Students will make conjectures and justify them in writing using mathematical reasoning and evidence.
At the end of the activity, students are asked several concluding questions that require them to analyze and evaluate their work. They focus
Subjects:
Grades:
5th - 9th
Types:
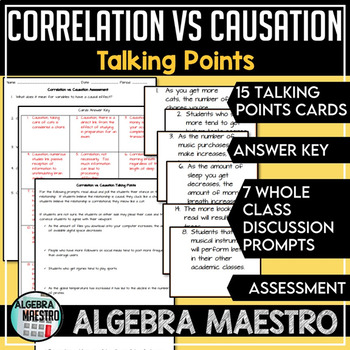
Correlation vs. Causation Talking Points, Prompt & Assessment
The Correlation vs. Causation Talking Points includes task cards, prompts to incorporate discussion, and an assessment. The task cards and assessment have answer keys attached with brief explanations. There are 15 task cards where students can work individually, pairs, or small groups identifying whether cards form a correlation or causation relationship. In the Talking Points, this is designed to be whole class where students take a side on what they believe a passage to be. The assessment
Subjects:
Grades:
5th - 12th
Types:
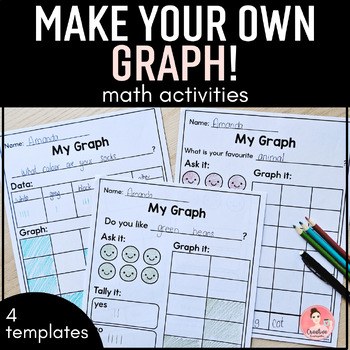
Make your own Graph Math Activity Templates (English and French included)
These 4 simple templates allow students to create their own graphs. They are perfect for reinforcing, reviewing, or assessing graphing skills and concepts.In the templates, a space is provided for them to write their question for the survey, tally the answers they receive from their peers, and graph.What is included:Do you like...? template: A simple graph that will have a yes or no answer. This includes a space where they can keep track of how many people have answered their question and the si
Subjects:
Grades:
K - 1st
Types:
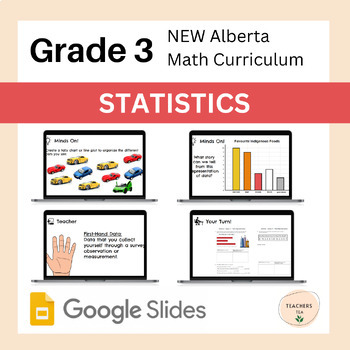
Alberta Grade 3 Math- Statistics- Google Slides COMPLETE UNIT
This is a COMPLETE UNIT to deliver the New Grade 3 Alberta Math Patterns and Sequences Unit.This is a ready-to-teach, ready-to-print unit that you can use in any elementary classroom. It is fully editable and can be adjusted for other standards and outcomes and grade levels.This Unit Includes the Google Slides Patterns and Sequences Unit, Student Sheets and Unit Exam to accompany the unit plan.New Alberta Math Curriculum Resources for Grade 3:AlgebraTimeMeasurementGeometryStatisticsPatterns and
Subjects:
Grades:
2nd - 4th
Types:
Also included in: Alberta Grade 3 Math - BUNDLE - 10 COMPLETE UNITS - FULL YEAR RESOURCE
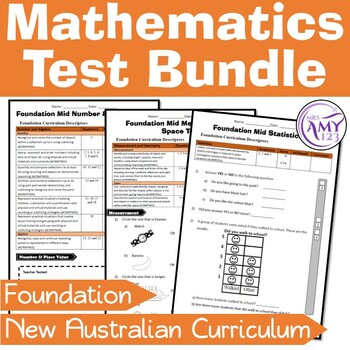
Foundation Mathematics Test Pack- Australian Curriculum
This is a bundle of tests that determine whether students have met the end of year requirements for a Foundation student in Number & Algebra, Measurement & Geometry and Statistics & Probability according to the Australian Mathematics Curriculum standards.A set of tests to be used during the middle of the year to assess students progress towards the outcomes has also been included.Includes a set for version 8.4 of the Australian Curriculum and version 9. WA teachers should use verison
Subjects:
Grades:
K
Types:
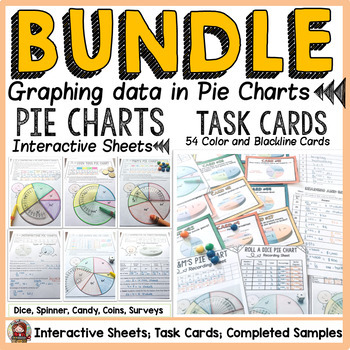
PIE CHARTS/PIE CIRCLE GRAPHS TASK CARDS AND {NO PREP} SHEETS BUNDLE
If you would like to teach a unit on pie charts using a combination of task cards and print-n- go activity sheets, then this activity pack fits the purpose. Please note that content in both worksheets and task cards is the same. You may have students work on the task cards at a center and then send the worksheets home for reinforcement or use them as an assessment tool to assess taught content or review concepts.***********************************************************************►► Details on
Subjects:
Grades:
3rd - 6th
Types:
Probability Carnival
**FULL Preview Available!**
Time for a carnival! In this probability project, students are asked to create a game of chance for a class carnival. Students will need to write directions for their game. They will also need to decide if the game is fair or unfair and explain why. Finally, the students are asked to list several possible outcomes of the game and give the probability of each outcome as a fraction and using the words likely, unlikely, certain or impossible.
This product includes:
A
Subjects:
Grades:
3rd - 6th
Types:
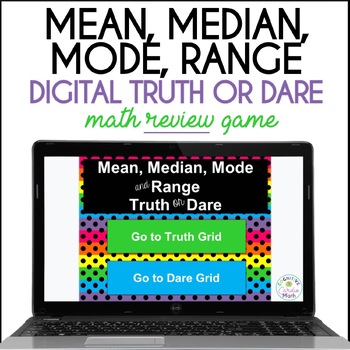
Mean, Median, Mode & Range Truth or Dare Math Game Digital Resource Math Centers
This unique mean, median, mode, range digital math game is an engaging, self-checking, easy way to review concepts - as a whole class, in small groups, partners, or individually. (This is the digital version of the FREE print Mean, Median, Mode & Range Truth or Dare Review Game.)The game begins with a Truth grid and Dare grid that allows students to then navigate through 36 question cards and 36 answer cards in Google Slides. As long as you have access to Google Slides, you can use this math
Subjects:
Grades:
4th - 6th
Types:
CCSS:
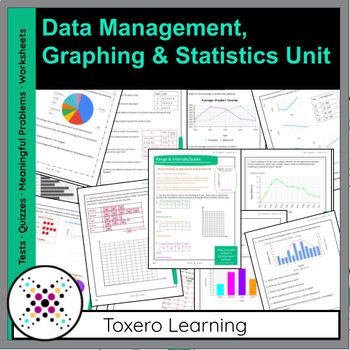
Grade 6, Data Management, Graphing & Statistics (Unit 7)
The Grade 6 Math Program is designed to take the stress out of teaching! It is a fusion of traditional practice, coupled with modern teaching approaches to encourage authentic learning and deeper thinking.Each unit can be successfully executed individually, but were ideally designed to go in consecutive order for the year. Some concepts reappear in other units to encourage a holistic approach to mathematics. Algebra is intentionally woven throughout the entire Grade 8 Program to provide ample an
Subjects:
Grades:
5th - 7th
Types:
Also included in: Grade 6 Math Year with EDITABLE Assessments, Growing Bundle
Showing 1-24 of 705 results


