287 results
4th grade statistics lessons
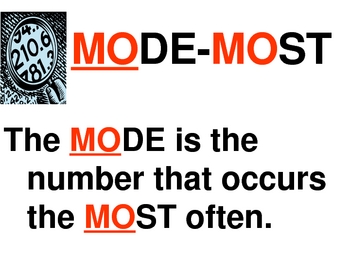
Statistics Mean, Median, Mode & Range Interactive PowerPoint by Erica
Introduce statistics including mean, median, mode and range with this colorful, interactive 22 slide PowerPoint. This interactive PowerPoint introduces each term and teaches a strategy for finding the value. There is also a trick or visual to help students remember the steps to find each one (mean, median, mode and range). Students are able to practice finding the mean, median, mode and range and then check within the PowerPoint. This is excellent for a statistics lesson or for students to e
Subjects:
Grades:
3rd - 6th
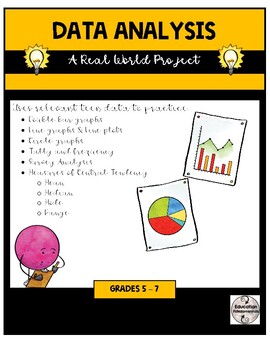
Data Analysis - Real World Project
**Now updated for distance learning!**This teaching package contains everything you need to make data analysis relevant to your teen or pre-teen student! Carefully crafted activities use real-life data from your class as well as generic, yet realistic, data from a fictitious group of teens.Activities require rigorous application of mathematical skills. Concepts covered include:• Measures of central tendency – mean, median, mode & range• Line plots• Tally & frequency• Double bar graphs•
Subjects:
Grades:
4th - 7th
Types:
Also included in: Data Analysis Teaching Bundle
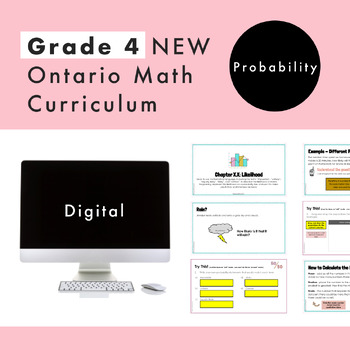
Grade 4 Ontario Math - Probability - Digital Google Slides + Form
Are you planning for the NEW Grade 4 Ontario Math Curriculum? This editable Google Slide and Google Form resource is what you need! This resource is for the DATA strand and and covers specific expectations for “D2. Probability”. In this resource, students will experience math through engaging real-life questions, storytelling through math, and interactive slides. What’s Included2 Google Slide presentations45 UNIQUE and EDITABLE Google Slides in totalSlides are editable for you to increase stud
Subjects:
Grades:
3rd - 5th
Types:
Also included in: Grade 4 NEW Ontario Math Curriculum Full Year Digital Slides Bundle
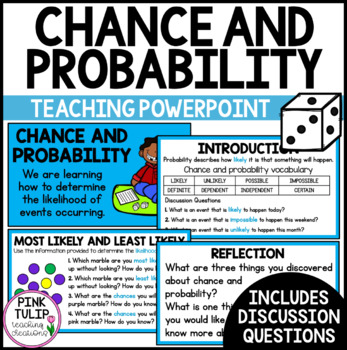
Chance and Probability - Teaching PowerPoint Presentation
Chance and Probability - Teaching PowerPoint PresentationCurriculum aligned PowerPoint presentation to guide explicit teaching of chance and probability, including likelihood. Includes:Learning intention.Introduction (tune in). Engaging graphics.Detailed explanations of various chance events.An in-depth vocabulary of terms such as likelihood, probability, chance, independent, dependent, and impossible.Discussion questions with answers.Reflection slides.Glossary. US spelling and UK spelling vers
Subjects:
Grades:
3rd - 5th
Also included in: Math PowerPoint Presentations Bundle
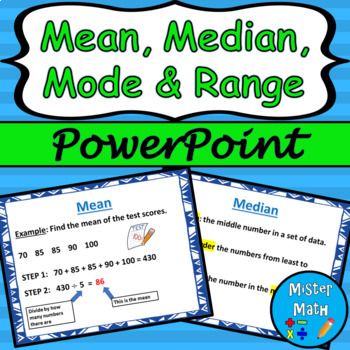
Mean, Median, Mode & Range PowerPoint Lesson
This is a PowerPoint Lesson to assist students in learning about finding the mean, median, mode, and range of data sets. The PowerPoint includes key vocabulary, as well as an example for each skill. Plenty of real-life examples are included to give students ample opportunities to connect the skills to the real world. The presentation also comes fully animated, with animations triggered by mouse click (or presentation pointer!)This PowerPoint lesson is also part of a BUNDLE that includes a guided
Subjects:
Grades:
3rd - 6th
Also included in: Mean, Median, Mode & Range PPT and Guided Notes BUNDLE
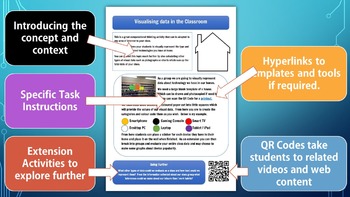
Computational Thinking & Data Analysis Task Cards | STEM | Digital Technologies
Most kids don’t naturally think like PROGRAMMERS, but you can enjoy the satisfaction of seeing them have a COMPUTATIONAL THINKING ⚡“A-ha!”⚡ moment as they learn with these visual, hands-on, NO PREP STEM activities.For those students who learn best by seeing, doing, and getting their hands dirty, this activity and card set will make abstract computing concepts as real as the classroom they’re sitting in. This pack uses students’ everyday interests, such as sports and friends, to teach them how al
Grades:
3rd - 8th
Types:
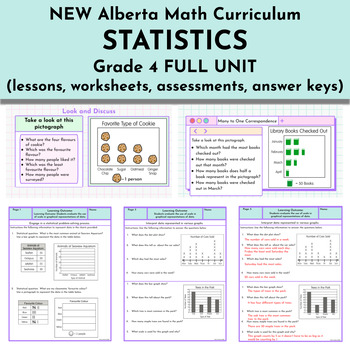
Statistics Unit - NEW Alberta Math Curriculum Grade 4
This Grade 4 Statistics resource is intended to meet the NEW 2023 Alberta Math curriculum expectations. Learning Outcome: Students evaluate the use of scale in graphical representations of data.Skills and Procedures:Engage in a statistical problem-solving process.Select an appropriate scale to represent data.Represent data in a graph using many-to-one correspondence.Describe the effect of scale on representation.Justify the choice of graph used to represent certain data.Compare different graphs
Subjects:
Grades:
4th
Types:
Also included in: FULL YEAR Alberta Math Curriculum - Grade 4
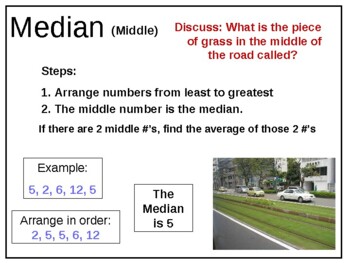
4th 5th 6th Grade Math Mean Median Mode Range MMMR Data Gr 4 5 6 Whole Numbers
This 16-slide Math PowerPoint introduces Mean, Median, Mode and Range and gives hints on how to remember each term. There are numerous practice problems as well. The numbers (data) used may be smaller than you desire, but the numbers are easily changeable and you'll still be able to use the examples. The last slide gives directions for a game to practice Mean, Median, Mode and Range using playing cards.
Subjects:
Grades:
4th - 6th
CCSS:
Grade 4 Probability Investigation and Games - Ontario Math 2020 - PDF and Slides
Teach your students about probability with these engaging investigations and games! These easy to follow activities teach the following expectations:Describe the likelihood of events happeningMake predictions and informed decisionsThis resource includes 1 investigation and 4 games.The investigation involves making predictions, conducting experiments, and comparing results with flipping coins and rolling number cubes.The four games provides students with a fun way to apply what they have learned
Subjects:
Grades:
4th
Types:
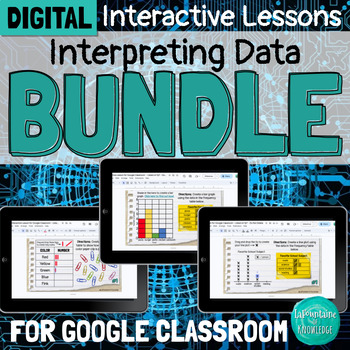
DIGITAL Interpreting Data Interactive Lesson Bundle for Google Classroom
This bundle of 3 digital interactive math lessons for Google Classroom teaches interpreting categorical and numerical data using frequency tables, bar graphs, and line plots. Each lesson includes: a video lesson (YouTube and Loom viewing options included) practice problems and activitiesteacher directions and answer keysThese lessons are ready to assign and easy for students to complete independently. Students will learn:important vocabulary - title, categories, tally marks, key, categorical dat
Subjects:
Grades:
3rd - 5th
Types:
4th Grade Data & Line Plots, 30 Enrichment Projects and 30 Test-Prep Problems
No-prep, 4th Grade data and line plots practice with 30 enrichment projects and 30 review test-prep questions aligned to the standards. Great for teaching the important data standards in a fun, engaging way. Excellent for early finishers, advanced math students or whole class practice. Print and go math enrichment! These work perfectly for distance learning as well.This resource includes thirty 4th Grade Common Core data and line plots problem solving test-prep questions and 30 no-prep data and
Subjects:
Grades:
4th
CCSS:
Also included in: 4th Grade Math Projects For Every Standard! Enrichment All-Year Bundle!
Alberta Grade 4 Math Bundle: Interactive Math Notebooks - All 13 Units Included
ALL 10 Interactive Math Notebooks - perfectly aligned with the NEW Grade 4 Math Alberta Program of Studies! ALL OUTCOMES are covered within these 10 interactive math notebooks!List of Units included:Place Value, Decimals, Addition & SubtractionPrime and Composite NumbersMultiplication & DivisionFractions & PercentagesAlgebraGeometry & AnglesMeasurement: AreaPatterns:TimeStatisticsWithin the units, many outcomes are combined into fewer lessons to make sure you have enough time to
Subjects:
Grades:
4th
Stem and Leaf
Stem and Leaf Plots: This Stem and Leaf Presentation also includes Frequency Tables and Dot Plots appropriate for 4th grade TEKS Math standards. Stem and Leaf Plots are often very difficult for students to understand. This Stem and Leaf PowerPoint carefully constructs the key concepts for students to understand and develop new understandings. It also shows a visual comparison of Stem-and-Leaf Plots to Frequency Tables and Dot Plots. It contains examples of data using fractions and decimals t
Subjects:
Grades:
4th
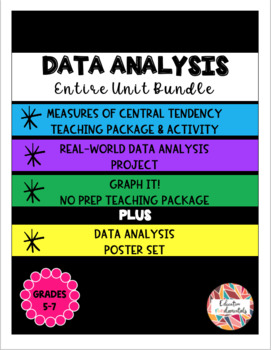
Data Analysis - Entire Unit Bundle ---SAVE!!SAVE!!SAVE!!
WOW! An entire teaching unit for Data Analysis!This resource contains ALL of my Data Analysis resources - 81 pages! Check out the preview for each item that is included.Download includes:- Graphing unit -- no prep, ready to print - line plot, line graph, bar graph, double bar graph, circle graph - student notes for how to make each graph - practice page for each type of graphNO PREP Graphing Unit- Measures of Central Tendency unit -- no prep, ready to print - student notes for
Subjects:
Grades:
4th - 7th
Types:
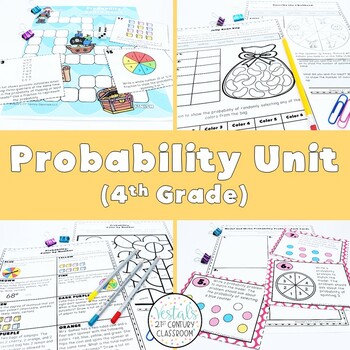
Probability Lesson Plans (Math SOL 4.PS.2) {Digital & PDF Included}
Are you looking for no-prep lessons and activities to teach probability? Look no further! These Probability Lesson Plans provide everything you need to teach determining probability, describing the degree of likelihood, and making lists to determine the total number of possible outcomes. Save time planning and your students will love completing the hands-on activities found in this unit.To take a closer look at some of the things included in this unit, check out the preview!What will students le
Subjects:
Grades:
4th
Types:
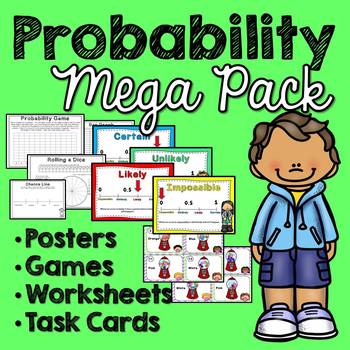
Probability (What are the Chances?) No Prep
Probability – What are the Chances? MEGA PackThis pack contains everything you need to help your students understand Probability and Chance with hands-on activities. This pack contains the following posters, games, worksheets, task cards and activities: 4 Posters – Certain, Impossible, Likely and Unlikely.Rolling a Dice ActivityBar Graph – Data Dice InvestigationProbability Game with DiceSpinner ActivitiesChoose the SpinnerCandy Math – FractionsCandy Math - Pie GraphCandy Math – Bar GraphCan
Subjects:
Grades:
1st - 4th
Types:
Also included in: Distance Learning Bundle (Grades 3-5) No Prep
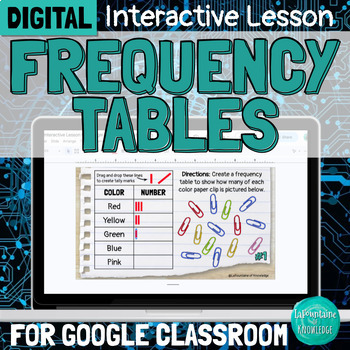
DIGITAL Frequency Tables Interpreting Data Interactive Lesson
This interactive Google Slides lesson introduces students to frequency tables and demonstrates how to interpret both categorical and numerical data. The lesson covers:the parts of a frequency table (title, categories, and tally marks)the difference between categorical and numerical datahow to interpret data (answer questions) using a frequency tablehow to create a frequency table This resource includes:a 9 minute video lesson (YouTube and Loom viewing options provided) 14 practice problems - stu
Subjects:
Grades:
3rd - 5th
Types:
Also included in: DIGITAL Interpreting Data Interactive Lesson Bundle for Google Classroom
Mean Median Mode Range | Doodle Math: Twist on Color by Number
Make probability and statistics review and practice a blast with this print-and-go Doodle Math activity. Includes three levels with 18 questions total to practice finding different measures of center (i.e. mean, median, mode, range) with whole number and decimal solutions. Each correct answer unlocks doodle patterns to complete a leaf-themed image perfect for any time of the year. If your students love color by number or color by code, they’ll love Doodle Math!Includes…✅ Level 1: Find mean, medi
Subjects:
Grades:
4th - 7th
Types:
Interpreting Graphs for the Middle & Junior High School: Book 2
Here is another set of data graphics for your students to analyze and interpret. Using survey results from the USA Today newspaper, students will be asked to explain what the graphics are illustrating. Each activity will ask the student to identify basic information presented in each graphic and make some projections based on the data given in the survey.
The activities in this packet are a great way to improve your student’s skills in taking apart graphic displays of information. Brin
Subjects:
Grades:
4th - 10th, Adult Education
Types:
4th Grade STAAR Math Data and Graphs,30 Enrichment Projects & Test-Prep Problems
No-prep, 4th grade STAAR data and graphs practice with 30 enrichment projects and 30 test-prep questions aligned to the TEKS. A great way to teach these important data standards in a fun, engaging way. Great for early finishers, advanced learners and whole class practice. Print and go math enrichment! This resource includes thirty 4th grade STAAR data and graphs problem solving test-prep questions and 30 no-prep data and graphs enrichment projects aligned to the STAAR 4th grade TEKS: 4.9A, 4.9B
Subjects:
Grades:
4th
Types:
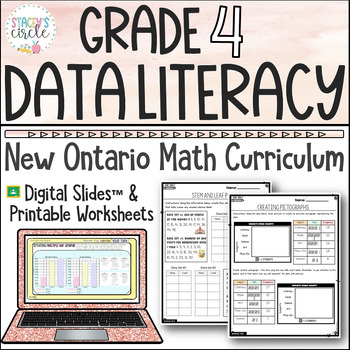
Grade 4 Data Literacy Ontario Math Digital Slides | Worksheets | Assessments
This product includes a comprehensive unit covering the entire Grade 4 Data Literacy Strand from the NEW Ontario 2020 Math Curriculum (ExpectationsD2.1, D2.2, D2.3, D2.4, D2.5, D2.6). Your purchase comes with 107 digital slides as well as printable practice, including tickets out the door, and includes 3-part lessons, activities and skill practice, FULLY EDITABLE digital and printable assessment, and social-emotional learning skills.Hey Grade 4 Ontario Teachers! You'll want this in your collecti
Subjects:
Grades:
3rd - 5th
Types:
How to Find an Average or Mean
Need a simple, scripted lesson to help you teach how to find an average?
This is a 20 page PDF file that includes:
Anchor Chart Materials,
1 worksheet for independent practice (Only one because you have a ton of those, right?)
Scripted lesson plans...it starts with the simplest examples that kids understand. Our district math coach helped with that ;)
Printables for your interactive notebooks (Or these can be used as exit slips!)
Thanks for stopping by Classy Gal Designs and Publishi
Subjects:
Grades:
4th - 6th
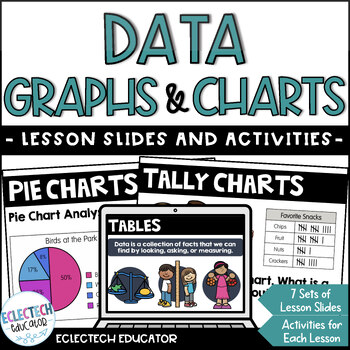
Data Management Collection, Charts and Graphs Digital Slides & Activities
Looking for fun ways to have students understand data? This math resource has everything you need to help students collect, describe, and represent statistical information using a variety of graphs and charts, such as bar graphs and pie charts. The SEVEN lessons, each with lesson slides, information, interactive activities, and practice questions, provide many opportunities to collect and represent data. TOPICS:⭐ Tables⭐ Tally Charts⭐ Bar Graphs⭐ Pictographs⭐ Pie Charts⭐ Line Plots⭐ Line GraphsE
Subjects:
Grades:
3rd - 4th
Types:
Elementary Jelly Bean Probability Game
Enjoy this awesome probability game using jelly beans for an introduction to making predictions based on probability. Extremely engaging for students practicing these skills!This would be best used for Grades 3-6!Please rate me and leave feedback.
Subjects:
Grades:
3rd - 6th
Showing 1-24 of 287 results


