45 results
4th grade statistics graphic organizers
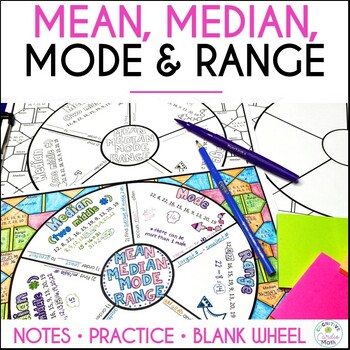
Mean, Median, Mode, Range Math Doodle Wheel | Notes and Practice Activity
Use this mean, median, mode, range doodle math wheel for notes and practice. Introduce each data measurement type as you teach it, or, you can use the math wheel to review all of them at once.What is a math wheel? A math wheel is a type of graphic organizer where students can:Take notes/guided notes inside the math wheelUse color, drawing, and doodling to help create memory triggersComplete practice problems in the pattern around the wheel, andColor the background patternStudents can keep these
Subjects:
Grades:
4th - 6th
Also included in: Mean, Median, Mode, Range Activity Bundle Math Centers
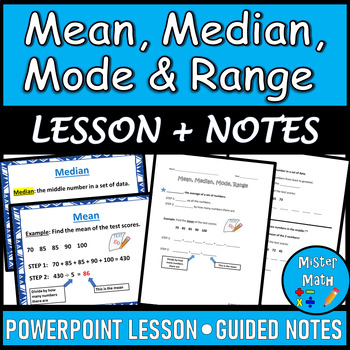
Mean, Median, Mode & Range PPT and Guided Notes BUNDLE
This Mean, Median, Mode & Range BUNDLE includes a PowerPoint Lesson and a corresponding Guided Notes Packet to assist students in learning about finding the mean, median, mode, and range of data sets. The PowerPoint and Guided Notes packet include key vocabulary, as well as an example for each skill. Additional practice problems are included that ask students to find the mean, median, mode and range of four data sets (for a total of 16 extra practice problems!) The presentation also comes fu
Subjects:
Grades:
3rd - 6th
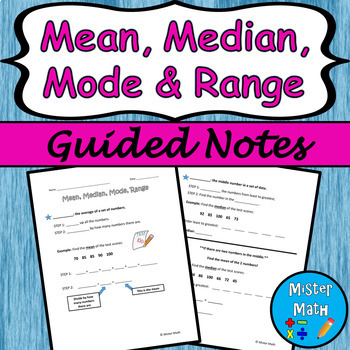
Mean, Median, Mode & Range Guided Notes
This is a guided notes resource to assist students in learning about finding the mean, median, mode, and range of data sets. The guided notes include definitions, as well as a guided example for each skill. An independent practice worksheet is included that asks students to find the mean, median, mode and range for four data sets (for a total of 16 extra practice problems!) An answer key is also provided.This Guided Notes packet is also part of a BUNDLE that includes a PowerPoint presentation to
Subjects:
Grades:
3rd - 6th
Also included in: Mean, Median, Mode & Range PPT and Guided Notes BUNDLE
How to Find an Average or Mean
Need a simple, scripted lesson to help you teach how to find an average?
This is a 20 page PDF file that includes:
Anchor Chart Materials,
1 worksheet for independent practice (Only one because you have a ton of those, right?)
Scripted lesson plans...it starts with the simplest examples that kids understand. Our district math coach helped with that ;)
Printables for your interactive notebooks (Or these can be used as exit slips!)
Thanks for stopping by Classy Gal Designs and Publishi
Subjects:
Grades:
4th - 6th
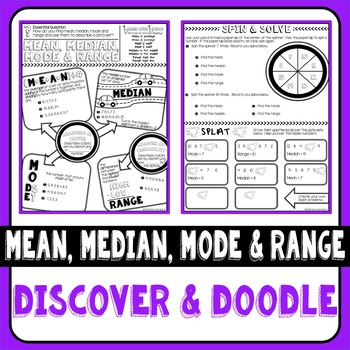
Mean, Median, Mode and Range Discover & Doodle
Looking for engaging notes that maximize class time and retention? Discover & Doodle pages are research based and combine words with visuals that boost student recall of information. They help students see what is important and visualize mathematical connections. Print full size for a binder, folder or handout. Need smaller size note pages to glue into a notebook? Follow the printing directions included to scale the pages down to notebook size.Discover & Doodle Pages Include⇒ Printi
Subjects:
Grades:
4th - 6th
Also included in: Statistics Discover & Doodle Bundle

Foldable- Line Plot, Bar Graph, Box-and-Whisker Plot, and Circle Graph
This foldable includes examples of four different graphs. The graphs included are the line plot, bar graph, box-and-whisker plot, and circle graph. There is a fill in the blank definition and an area devoted to brief practice of the analyzing of these graphs. Answer Key included.
Subjects:
Grades:
4th - 8th
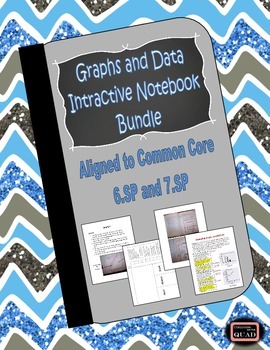
Graphs and Data Interactive Notebook Lessons {6.SP and 7.SP}
Looking for step by step instructions for interactive notebooking using data and graphs? This file is exactly what you need! There are complete instructions for notebook organization and how students use a self assessment stop light graphic organizer to communicate their comprehension of the lesson. For each lesson, there are complete instructions, student foldables to make the entries completely interactive, and pictures of sample pages. Each lesson also contains data to use with the foldables.
Subjects:
Grades:
4th - 7th
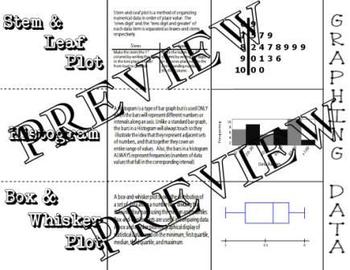
Graphing Data Histogram Box Whisker Stem Leaf Plot Foldable Interactive Notebook
Graphing Data Histogram Box Whisker Stem Leaf Plot Foldable Interactive Notebook
This is a single page PDF foldable that explains the differences in Histograms, Box and Whisker Plots and Stem and Leaf Plots, as well as shows an example of each.
The folding directions are included.
All feedback is welcomed
Follow Me on TpT!
Subjects:
Grades:
4th - 12th, Adult Education
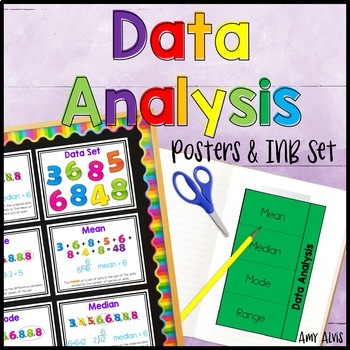
Data Analysis Posters and Graphic Organizer INB Set Anchor Chart
This poster and interactive notebook (INB) set covers data set, mean, median, mode and range. This set includes a ONE interactive foldable graphic organizer (INB), FIVE posters (8.5 X 11) and THREE versions of the data set cards.The posters and data cards come in a color version as well as a black and white version.Thank you for looking,Amy Alvis
Subjects:
Grades:
4th - 6th
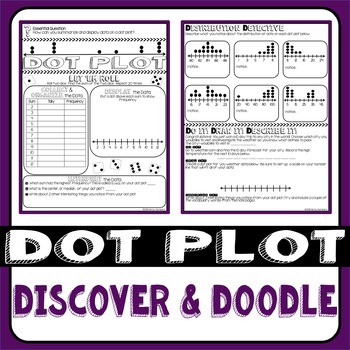
Dot Plot Discover & Doodle
Looking for engaging notes that maximize class time and retention? Discover & Doodle pages are research based and combine words with visuals that boost student recall of information. They help students see what is important and visualize mathematical connections. Print full size for a binder, folder or handout. Need smaller size note pages to glue into a notebook? Follow the printing directions included to scale the pages down to notebook size.Discover & Doodle Pages Include⇒ Printi
Subjects:
Grades:
4th - 6th
Also included in: Statistics Discover & Doodle Bundle
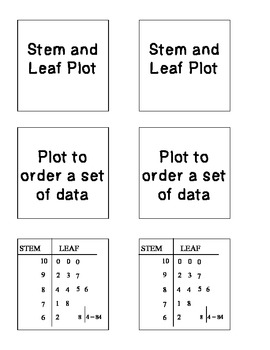
Types of Graphs Foldable-FREEBIE
Types of graphs foldable cards. Two per page. Great to use with a shutterfold.
Graphs included: Stem and Leaf, Line Plot, Line Graph, Bar Graph, Frequency Table, Circle Graph
Used for note taking purposes.
Subjects:
Grades:
3rd - 8th
Types:
Mean, Mode, Median, and Range Foldable Graphic Organizer
This foldable graphic organizer helps students learn about mode, median, mean, and range. It can be glued into a math notebook or used as an assessment. As a bonus I've also included 4 posters. Please see my preview file for more information and pictures.
Subjects:
Grades:
4th - 6th
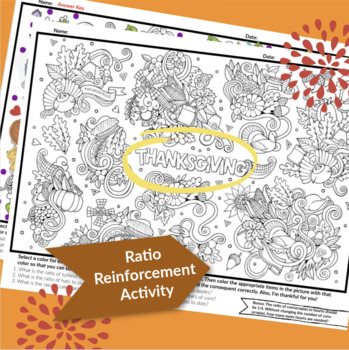
Ratios of Thanksgiving Activity
Students will color specific items to reveal the ratios within this complicated image. Reinforces understanding of mathematical ratios, antecedent, and consequent placement as well as simplification of ratios/fractions. Answer key included.
Subjects:
Grades:
3rd - 12th
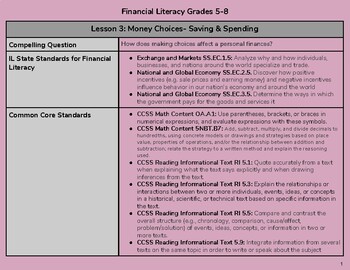
Outstanding Financial Literacy Curriculum Part 3, grades 5-8
HIGH QUALITY, HIGH ENGAGEMENT, REAL WORLD APPLICATION!This Financial Literacy Unit 3 is appropriate for grades 5-8. This unit has 7 lessons that could support a 6-8 week long inquiry based curriculum on its own. It can also be used as supplemental material for math, social studies, or ELA quarterly classes. Each unit provides standard based lessons written at the highest levels of Bloom's. It incorporates a variety of multi medias, exposure to current events, problem solving tasks, predictive re
Subjects:
Grades:
4th - 10th
Types:
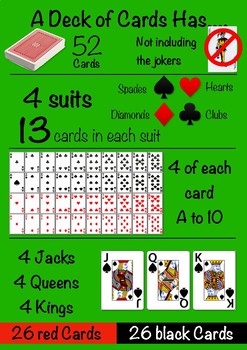
Chance, Statistics and Probability Playing Card Poster
This classroom display provides an engaging visual and supportive teaching aide for the teaching of probability facts related to a standard deck of playing cards.
Use this vivid resource to compliment your chance and probability lessons or simply to brighten up your mathematics display area.
Subjects:
Grades:
PreK - 12th
Types:
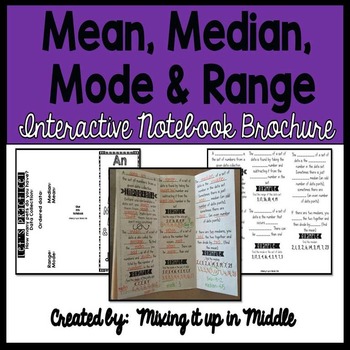
Mean, Mode, Range, and Median Interactive Notebook Brochure
Mean, Median, Mode, and Range Interactive Notebook Brochure. This no-prep brochure is a great way to introduce the topic to your students. There are step by step directions with an opportunity to practice each skill. The last page of the brochure is a whole class guided practice, which involves all of your students input. Once the brochure is complete, the students can glue it right into their math interactive notebooks!
You may enjoy my other Math Interactive Notebook Brochures as well!
Subjects:
Grades:
4th - 7th
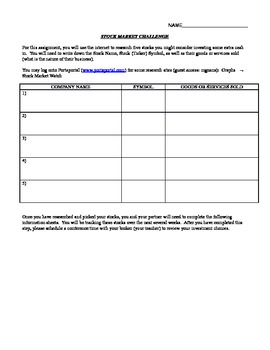
Stock Market Challenge Information Sheet
This document provides students a place to record the information they have gathered from their Stock Market research. It includes a place for students to record their stocks' 52-week high and low, dividends paid, does the company produce goods or provide services, as well as the reasoning as to why your student chose to purchase that particular stock. There are enough recording sheets for 5 stocks. This is a great way to teach students how to record and organize information for later use. If
Subjects:
Grades:
4th - 7th
Types:
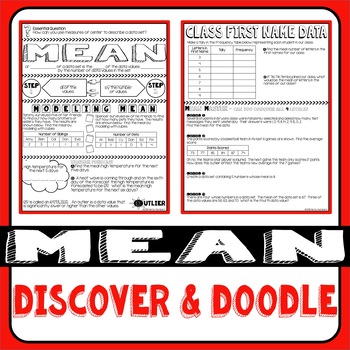
Mean Discover & Doodle
Looking for engaging notes that maximize class time and retention? Discover & Doodle pages are research based and combine words with visuals that boost student recall of information. They help students see what is important and visualize mathematical connections. Print full size for a binder, folder or handout. Need smaller size note pages to glue into a notebook? Follow the printing directions included to scale the pages down to notebook size.Discover & Doodle Pages Include⇒ Printi
Subjects:
Grades:
4th - 6th
Also included in: Statistics Discover & Doodle Bundle
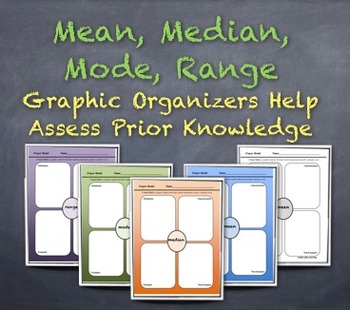
Measures of Central Tendency Graphic Organizers: Assess Prior Knowledge "Jigsaw"
Use these colorful PDFs to assess students' prior knowledge of mean, median, mode and range.
Consider counting off by 4's, and asking each student to complete one organizer individually, knowing they will group with others who worked on the same term after a few minutes.
Then, group students in "expert groups" of students who all had the same term, to hear one another's ideas and add to each organizer.
Finally, consider having a representative from each group present his/her organizer to
Subjects:
Grades:
4th - 9th
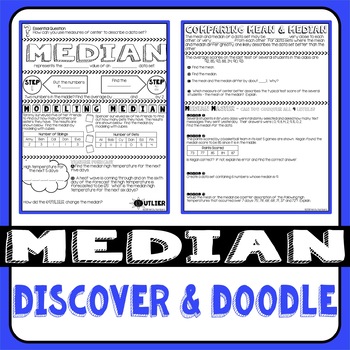
Median Discover & Doodle
Looking for engaging notes that maximize class time and retention? Discover & Doodle pages are research based and combine words with visuals that boost student recall of information. They help students see what is important and visualize mathematical connections. Print full size for a binder, folder or handout. Need smaller size note pages to glue into a notebook? Follow the printing directions included to scale the pages down to notebook size.Discover & Doodle Pages Include⇒ Printi
Subjects:
Grades:
4th - 6th
Also included in: Statistics Discover & Doodle Bundle
Mean, Median, Mode, Range, & Box Plot Foldable
Mean, Median, Mode, Range, & Box Plot Foldable
No prep! Simply copy the foldable pages front and back. If you want it for your Interactive Math notebook, then I suggest shrinking it by 80%.
Answer key included!
Subjects:
Grades:
3rd - 9th
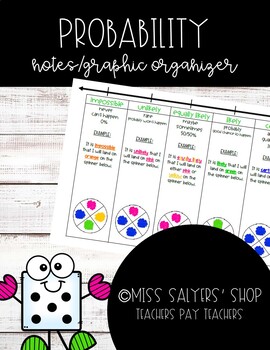
Probability Notes/Graphic Organizer
This easy-to-follow product is a great visual for students to understand probability vocabulary: impossible, unlikely, equally likely, likely, and certain.
Subjects:
Grades:
2nd - 8th
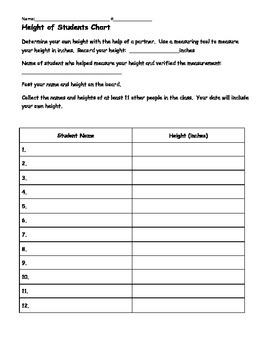
Stem and Leaf Plot, Bar Graph, Mean, Median, Mode, Range
Students will practice measuring their heights using yard sticks or measuring tape. They will then share their data with classmates to create a stem and leaf plot. They will then find the average height of boys and average height of girls to create a bar graph. Questions to help them analyze the data are included as well as extra questions based on a teacher-created stem and leaf plot.
This can be used after the graphing and statistics unit is taught to 5th graders to reinforce the skills or
Subjects:
Grades:
4th - 6th
Showing 1-24 of 45 results


