33 results
4th grade statistics independent work packets
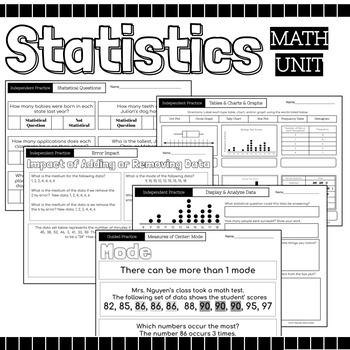
Statistics Math Packet {Data, Charts, Graphs, Mean, Median, Mode, Range, Spread}
52 Page Statics Unit Includes: Guided Instruction & Independent Practice Pages Usage Suggestions and IdeasThis resource can be utilized in numerous ways, here are some ideas:use for guided practiceassign as partner workassign as independent practicecan be used for morning workuse for reteaching in small group settinguse as review prior to assessmentuse as review in continuing to strengthen skillassign for homeworkuse as independent work during math centersTopicsRecognize Statistical Question
Subjects:
Grades:
4th - 12th
2024 Solar Eclipse Math - A Bank of 90 Math Problems About the Solar Eclipse
Combining math and science is a natural. With all the excitement surrounding the 2024 total solar eclipse, it only makes sense to extend our math knowledge and skills to the numbers involved with the incredible show that is about to take place in the sky. This resource contains a Bank of Math Problems for the 2024 Total Solar Eclipse. It includes 90 math problems (and answers) that involve the following skills: - Identifying the least and greatest values - Ordering numbers from least to greate
Subjects:
Grades:
4th - 7th
Mean as a Balance Point for Google Classroom
This resource was designed for distance learning! It is completely editable and is so easy to assign in Google Classroom. This resource reviews the concept of mean and introduces the process of using a frequency line graph to calculate balance point. Be sure to make a copy for each student when assigning in Google Classroom!
Subjects:
Grades:
4th - 7th
Tree Diagrams and The Fundamental Counting Principle for Distance Learning
This probability resource was created for distance learning! This resource gives students the opportunity to practice creating probability tree diagrams virtually. Notes and an example scenario are given before students work through 3 additional scenarios on their own. This resource is ready to use and requires no prep! It is so easy to assign in Google Classroom!
Subjects:
Grades:
4th - 7th
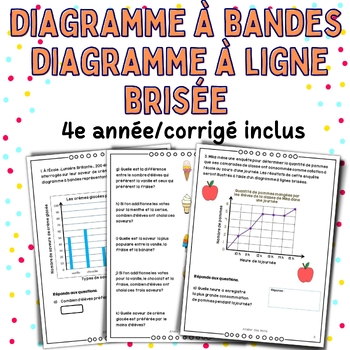
Math Worksheet 4th grade-Le diagramme à bandes Le diagramme à ligne brisée 4e
Ressource pour consolider ou réviser le diagramme à bandes et le diagramme à ligne brisée. Cette ressource inclut des exemples de diagrammes à analyser pour recueillir des données, ainsi que des modèles de diagrammes à compléter en utilisant les informations fournies.Elle peut être utilisée en ateliers et centres de mathématique, comme travail supplémentaire ou devoir. Il convient aussi pour l’apprentissage à domicile. Je vous encourage à vérifier les aperçus pour juger si le document convient à
Subjects:
Grades:
4th
Also included in: Math Bundle Worksheets 4th grade - Ensemble de mathématique 4e année
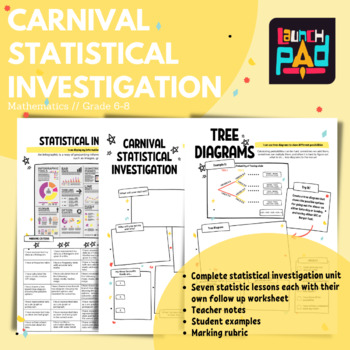
Carnival Statistical Investigation // Full Unit
You have been asked to run a stall at the Famous City Carnival! It is up to you what you sell, however, you want to make the most profit possible. It is important that you gain an understanding of what people like so that you make sales. You will need to complete a statistical investigation to create the stall as well as show your understanding and application of statistics. Students will learn and then apply statistical knowledge in each lesson of this unit and at the end create an infographic
Subjects:
Grades:
4th - 8th
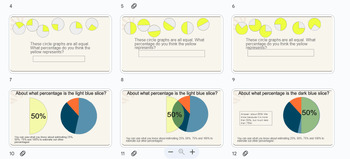
Estimating Percentages 2: Circle Graphs POWERPOINT
This mathematics PowerPoint resource is intended to support learners working on Virginia Standard of Learning:6.NS.1 a)Estimate and determine the percent represented by a given model (e.g., number line, picture, verbal description), including percents greater than 100% and less than 1%. This material was development for 1:1 review and tutoring. Teachers may find it useful for younger learners and students receiving special/exceptional education as well as with students learning in states other t
Subjects:
Grades:
4th - 6th
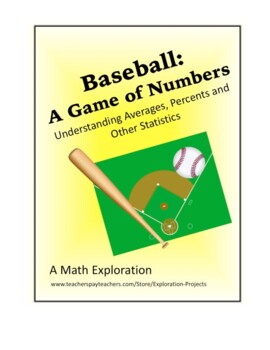
Math- Baseball: A Game of Numbers
In this Exploration, students will examine the statistics of four baseball players. The focus is to understand how the data is calculated. This classic American sport has always used math to keep track of everything that happens in the game. This math Exploration includes detailed, student-friendly Steps to Success that lead the learner through the process of creating a high-level, quality independent project. To add rigor and thoughtfulness, students reflect on their Exploration by answering s
Subjects:
Grades:
3rd - 8th
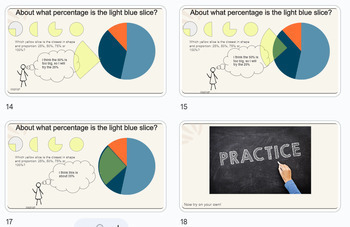
Estimating Percentages 2: Circle Graphs
This mathematics Slide Deck resource is intended to support learners working on Virginia Standard of Learning:6.NS.1 a)Estimate and determine the percent represented by a given model (e.g., number line, picture, verbal description), including percents greater than 100% and less than 1%. This material was development for 1:1 review and tutoring. Teachers may find it useful for younger learners and students receiving special/exceptional education as well as with students learning in states other
Subjects:
Grades:
3rd - 6th
CCSS:
Estimating Percentages: 25%, 50%, 75%, 100% POWERPOINT
This mathematics Slide Deck resource is intended to support learners working on Virginia Standard of Learning:6.NS.1 a)Estimate and determine the percent represented by a given model (e.g., number line, picture, verbal description), including percents greater than 100% and less than 1%. This material was development for 1:1 review and tutoring. Teachers may find it useful for younger learners and students receiving special/exceptional education as well as with students learning in states other t
Subjects:
Grades:
4th - 6th
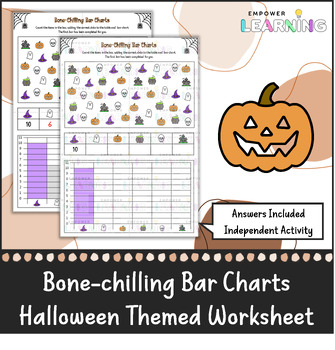
Bone-chilling Bar Charts - Halloween Math Worksheet
Bone-chilling Bar ChartsEngaging Halloween worksheet on bar charts, requiring students to count items, fill in a table and then construct a bar chart using this information. This resource comes with an answer key with completed table and bar chart.
Subjects:
Grades:
3rd - 8th
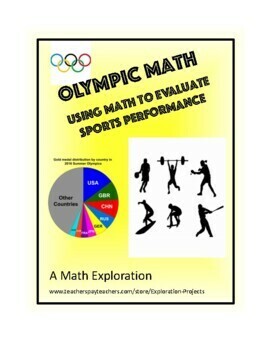
Math- Olympic Math:Using Math to Evaluate Sports Performances
Students will look at the Olympic games through a mathematical lens. Using their mathematical thinking they will use data and research to create graphs and story problems. If you are doing this Exploration during an Olympic year, students can use the data from this year. If there are no Olympics happening this year, choose a historic Olympics to analyze.This math Exploration includes detailed, student-friendly Steps to Success that lead the learner through the process of creating a high-level,
Subjects:
Grades:
3rd - 8th
Distance Learning CANADA Math 5: STATISTICS Complete Unit
Ready for the Bell lessons are ideal for remote learning or learning from home for short (single lesson) or long term learning. They are perfect for partnering with parents when students are homebound and can be delivered electronically or in lesson packs.Our resources are created to:•provide a number of formats for learning:-paper only print,-paper and computer, or-fully online•the facilitator/teacher's guides give teachers and parents complete instructions for learning:-each lesson provides an
Subjects:
Grades:
4th - 6th
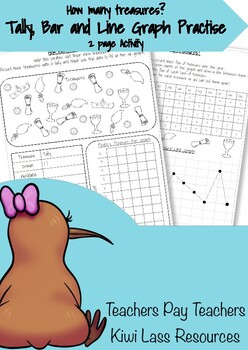
How Many Treasures?
A 2 page activity sheet for introducing or practising tally, bar, and line graphs with your students!
Subjects:
Grades:
4th - 7th
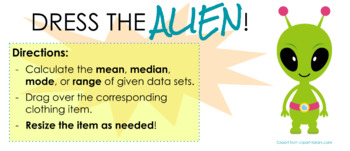
Mean, Median, Mode, Range - Dress the Alien! (Google Slides)
Mean, Median, Mode, and Range Practice"Dress the Alien!"- 100% digital (Google Slides)- Answer key included- Students calculate mean, median, mode, and range- Students select clothing items based on the answers they find
Subjects:
Grades:
4th - 8th
Distance Learning CANADA Math 4: STATISTICS Complete Unit
Ready for the Bell lessons are ideal for remote learning or learning from home for short (single lesson) or long term learning. They are perfect for partnering with parents when students are homebound and can be delivered electronically or in lesson packs.Our resources are created to:•provide a number of formats for learning:-paper only print,-paper and computer, or-fully online•the facilitator/teacher's guides give teachers and parents complete instructions for learning:-each lesson provides an
Subjects:
Grades:
3rd - 5th
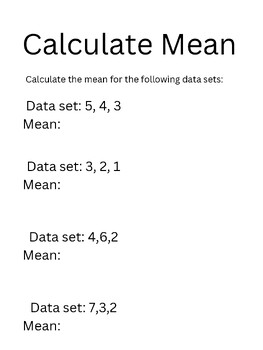
Calculate Mean From A Data Set
Use this activity to provide students with an opportunity to practice calculating the mean from a set of data. I personally used this for the MCAS Alt as of the 2022-2023 school year. Please check that it is appropriate for updated regulations if used for that purpose, but that was the original intended use for this.
Subjects:
Grades:
3rd - 6th
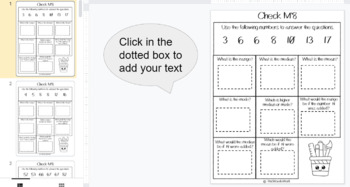
Probability Check M'8
Probability work to use digitally or printed.Students will share their knowledge or mean, median and mode. Find the probability using dice, spinners and candy bags. Use these as formative assessment or daily practice.Blackline masters included of the worksheets! Use these to differentiate the assignment for your students or even have your students make up their own. Answer Key is also included.
Subjects:
Grades:
4th - 6th
Mean, Median, and Mode for Distance Learning
This resource was created for distance learning. The Google Slides introduce the concepts, offer practice for each concept, and close with a student reflection. This resource is SO easy to assign on Google Classroom and it requires NO PREP!
Subjects:
Grades:
4th - 6th
Survey Says - Statistics Project
A great collaborative math project to add to your statistics unit or to finish out the year. Students will create a statistical question and conduct a survey in order to gather, analyze, and interpret data. Students will:-Create a question-Conduct a survey-Analyze their data by finding the mean, median, mode, range, and first and third quartiles-Display their data on a box and whisper, frequency table, and histogram-Interpret and reflect on their data in a short response-Present their data to th
Subjects:
Grades:
4th - 8th
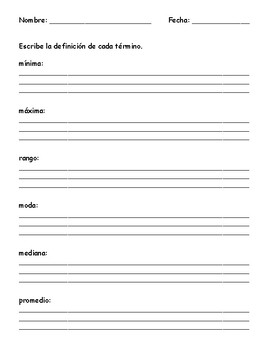
datos en español: mínima, máxima, rango, moda, mediana, promedio (media) Spanish
Hojas de practica con mínima, máxima, rango, moda, mediana, promedio (media) en forma de historias numericas y definiciones. Practice sheets using minimum, maximum, range, mode, median and average. The worksheets include word problems and writing definitions in Spanish.
Subjects:
Grades:
3rd - 8th
CCSS:
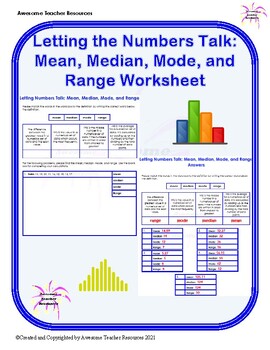
Letting Numbers Talk: Mean, Median, Mode, and Range Worksheet
The packet starts with suggestions for reinforcing and enriching learning related to data. This worksheet begins with the definitions of mean, median, mode, and range. Students are to write the correct word under the matching definition. Then students are given a data set. They are to find the mean, median, mode, and range. There is a substantial amount of space provided for students to complete their calculations. There is an answer key.
Subjects:
Grades:
4th - 6th
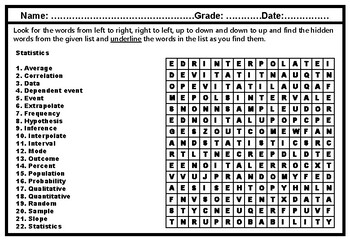
Statistics, Word Search Worksheet
Statistics, Word Search Worksheet has 1 wordsearch with 22 words.Words are from left to right, right to left, upto down and down to up in the wordsearches.Children across all age groups just love wordsearch challenges. Excellent revision tool,learning spellings, and useful for Earlyfinishers, Homework packet, Sponge activityand Sub plans.May be used for continued activitiesaccording to the teacher.
Subjects:
Grades:
4th - 12th, Staff
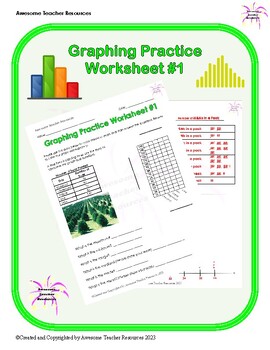
Graphing Practice Worksheet #1
This packet begins with suggestions for reinforcing and enriching learning related to graphing. The graphing practice worksheet includes three opportunities for students to practice graphing with two bar graphs and one tally chart. For each incident, students need to find the mean, median, mode, maximum, minimum, and range. There is an answer key.
Subjects:
Grades:
3rd - 5th
Showing 1-24 of 33 results


