3 results
Statistics Common Core RST.6-8.7 resources

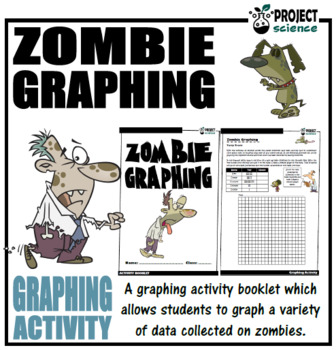
Graphing Zombies
A theme based activity booklet which allows students to graph a variety of data collected on zombies.Two types of graphs can be created from the data, column and line.A great way for students to practice their graphing skills.Includes an additional page of questions with solutions based on each of the graphs.If you would like updates on free and new products please follow me by clicking the 'Follow Me' link above.Clipart by:Ron Leishmanhttps://www.teacherspayteachers.com/Store/Ron-Leishman-Digit
Subjects:
Grades:
4th - 7th
Types:
CCSS:

Making Comics Issue #4: Climate Change
While previous issues used comics to explore comics and writing, Making Comics Issue #4 uses comics to present information related to a specific topic: climate change! This is a great award-winning resource for any science classroom. It can be a solid reading resource around Earth Day to give students something other than a textbook to look at. In addition to climate change, it also presents the fundamentals of modeling and includes historical notes on the development of climate change models ov
Subjects:
Grades:
Not Grade Specific
Types:
CCSS:

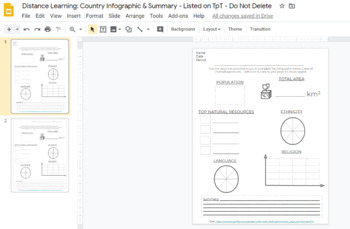
Distance Learning: Country Infographic & Summary
Use Google Slides to Create & Print an infographic focusing on the country of your choosing based on the latest information found at the CIAworldfactbook one-page summary page, Junior Scholastic Almanac, or other sources. Great for introducing a new area of study. Type onto the slide directly, use the shapes tools or print for a spiffy worksheet.- Pro Tip: Use these sheets for comparing two countries or time periods in the same area to show change over time.-Advanced Learners/Technowizards:
Grades:
Not Grade Specific
Showing 1-3 of 3 results


