1,284 results
Graphing graphic organizers under $5
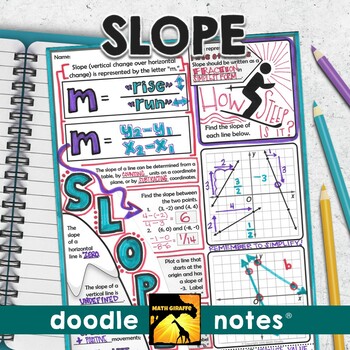
Slope Doodle Notes | Visual Interactive Math Doodle Notes for Algebra
Slope "doodle notes" - visual note taking pages with interactive tasks for building stronger retention of slope of a line lesson concepts in AlgebraBoost your students' focus and memory! The blend of graphic and linguistic input in these guided visual notes helps students' brains to convert the information to long-term memory more easily. When students color or doodle in math class, it activates both hemispheres of the brain at the same time. There are proven benefits of this cross-lateral brai
Grades:
7th - 9th
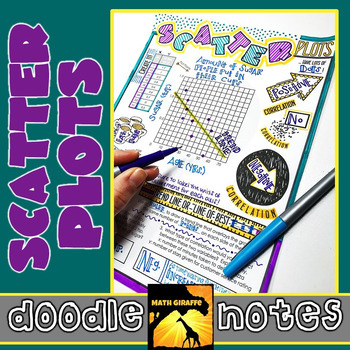
Scatter Plots Doodle Notes
Creating & Analyzing Scatter Plots - Visual Interactive "Doodle Notes"
When students color or doodle in math class, it activates both hemispheres of the brain at the same time. There are proven benefits of this cross-lateral brain activity:
- new learning
- relaxation (less math anxiety)
- visual connections
- better memory & retention of the content!
Students fill in the sheets, answer the questions, and color, doodle or embellish. Then, they can use it as a study guide later on.
C
Subjects:
Grades:
7th - 8th
CCSS:
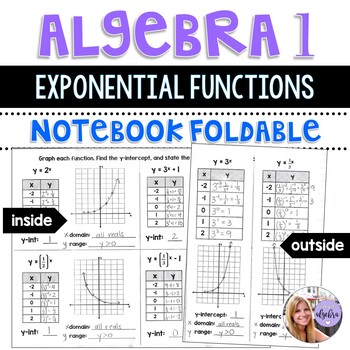
Algebra 1 - Using and Graphing Exponential Functions - Foldable
This is a foldable designed for math interactive notebooks.Here is the link of me teaching this lesson using this resource on YouTube! Feel free to use this as additional support for your students. https://www.youtube.com/watch?v=qdOB_GB6Yok&list=PLDKrf9k92mfhuvcLRdKEA52aUdjOSfYQt&index=4&t=2sIt walks students through the process of graphing exponential functions in the form of y = a^x. The purpose of the problems chosen for this foldable are to master the basic exponential function
Subjects:
Grades:
7th - 10th
Also included in: Algebra 1 - Second Half of the School Year Foldable GROWING BUNDLE
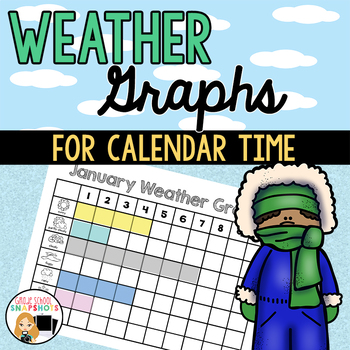
Weather Graphs for Calendar Time
This is a set of monthly weather graphs to be used at calendar time. A student will be the weather reporter and fill in the graph with that day's weather. Includes 12 months of graphs. One set of 12 has sunny, partly cloudy, cloudy, foggy, rainy, snowy, and stormy. The second set of 12 includes all of the previous and also includes windy. They are provided with 10 or 20 columns. Choose the set that works for you.Also included are pocket chart cards for introducing the weather. You can als
Subjects:
Grades:
PreK - 2nd
Also included in: Back to School Bundle of Essentials
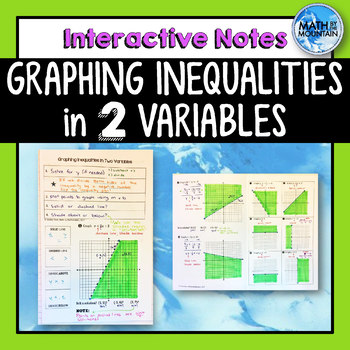
Graphing Linear Inequalities in 2 Variables Interactive Notebook Notes
These notes are perfect for an interactive notebook (INB) and are built to reinforce prior concepts. Help your students see the process graphing inequalities in two variables on the coordinate plane. Explore the special cases of vertical and horizontal inequalities! In some examples, students must solve for y prior to graphing, which is a fantastic review of (1) rerwriting equations, (2) remembering the flip the sign, and (3) identifying slope and y-intercept! The front page of these notes are
Subjects:
Grades:
6th - 10th
CCSS:
Also included in: Unit 7 - Systems of Equations & Inequalities - Interactive Notebook Kit
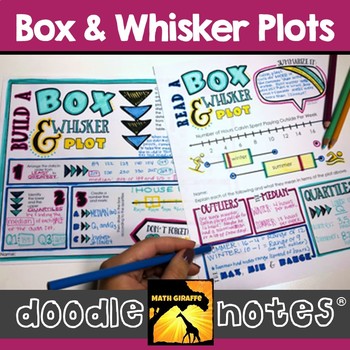
Box and Whisker Plots Doodle Notes
reading and creating box & whisker plots: visual interactive "doodle note" setWhen students color or doodle in math class, it activates both hemispheres of the brain at the same time. There are proven benefits of this cross-lateral brain activity:- new learning- relaxation (less math anxiety)- visual connections- better memory & retention of the content!Students fill in the sheets, answer the questions, and color, doodle or embellish. Then, they can use it as a study guide later on. G
Subjects:
Grades:
6th - 8th
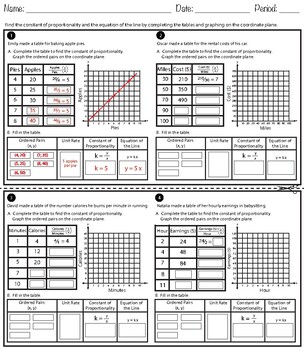
Identifying Constant of Proportionality Using Tables, Graphs and Equations
These worksheets can be served as a graphic organizer or a handout to practice in identifying constant of proportionality (unit rate) using tables, graphs, equations and verbal descriptions of proportional relationships. Students will make tables of equivalent ratios, find missing values in the tables, and plot the pairs of values on the coordinate plane to identify the constant of proportionality. Students will also select statements which is true or false in interpreting a point (x, y) on t
Grades:
6th - 8th

Solving Systems of Equations by ELIMINATION *Flowchart* Graphic Organizers
Help your students visualize the solving process for the elimination method of solving systems of linear equations. Students are able to easily lead themselves or others through a problem, even if it is their first time using this method. Includes*Solving by Elimination Flowchart Graphic Organizer (half-sheet size)*Solving by Elimination Flowchart Graphic Organizer (full-sheet size)*Solving by Elimination Flowchart Graphic Organizer (mini-book size)Half sheets and mini-books are great for intera
Grades:
7th - 12th
CCSS:
Also included in: Systems of Equations *Flowchart* Graphic Organizers BUNDLE
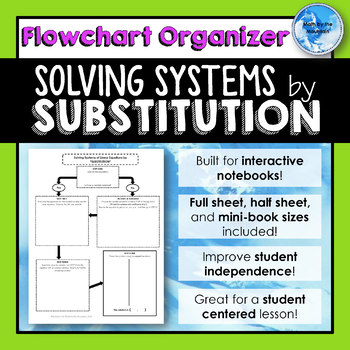
Solving Systems of Equations by SUBSTITUTION *Flowchart* Graphic Organizers
Help your students visualize the solving process for the substitution method of solving systems of linear equations. Students are able to easily lead themselves or others through a problem, even if it is their first time using this method. Includes*Solving by Substitution Flowchart Graphic Organizer (half-sheet size)*Solving by Substitution Flowchart Graphic Organizer (full-sheet size)*Solving by Substitution Flowchart Graphic Organizer (mini-book size)Half sheets and mini-books are great for in
Grades:
7th - 12th
CCSS:
Also included in: Systems of Equations *Flowchart* Graphic Organizers BUNDLE
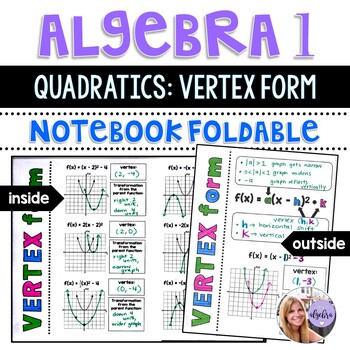
Algebra 1 - Transformations of Quadratic Functions - Vertex Form - Foldable
This is a foldable designed for interactive math notebooks. There are also 2 bonus pages of practice problems for the students to do, as well!Here is the link of me teaching this lesson using this resource on YouTube! Feel free to use this as additional support for your students. https://www.youtube.com/watch?v=lKABemkVP7c&list=PLDKrf9k92mfhAvVHMJ4Xu_Hcw-9fRV6jQ&index=6&t=3sThis foldable walks students through the process of the following transformations:Each graph starts with the p
Subjects:
Grades:
8th - 11th
Also included in: Algebra 1 - Second Half of the School Year Foldable GROWING BUNDLE
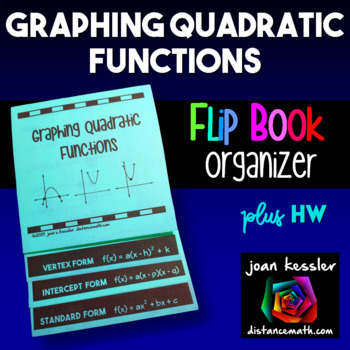
Graphing Quadratic Functions Parabolas Flip Book Foldable plus HW
This Quadratics / Parabolas Flip Book foldable provides a summary of the graphs of Quadratic Functions when the equations are given in Standard Form, Intercept Form, and Vertex Form. Within the foldable are definitions, formulas, examples, and problems for students to complete along with 6 Parabolas for them to graph using each of the 3 forms. There is room for extra notes as well as labeling the characteristics of each graph.Also included is :the solution key in its own flip bookAdditional work
Subjects:
Grades:
8th - 10th
CCSS:
Also included in: Algebra 2 Activity Bundle
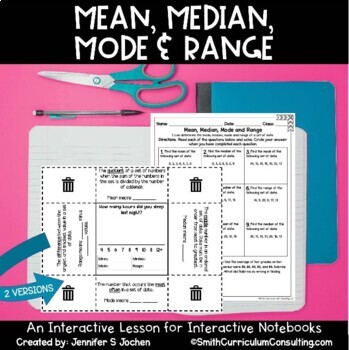
Mean, Median, Mode and Range Foldable Interactive Notebook Lesson with Practice
Ready to review the basics of Mean, Median, Mode and Range? This flippable has all that you need for your students to have a resource for the definition, a keyword to help them remember, as well as a graph to compile data from the class and determine the Mean, Median, Mode, and Range for your class data!Includes:Teacher Directions with a full-color photoMean, Median, Mode, and Range Foldable (2 versions)Mean, Median, Mode, and Range Practice SheetMean, Median, Mode, and Range Practice Sheet Answ
Subjects:
Grades:
5th - 7th
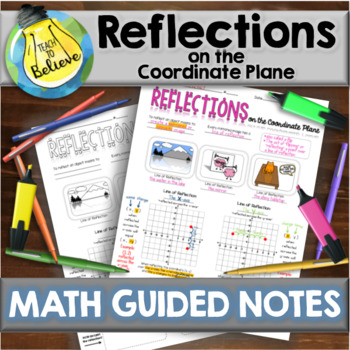
Reflections on the Coordinate Plane - Guided Notes
Reflections on the Coordinate Plane - Guided Notes These notes explain to your students how to reflect a point across an axis. What is Covered:-Explanation of "Line of Reflection"-Explanation of Reflecting Across an Axis-ExamplesWhat's Included:-Blank Student Copy-Typed Colorful Key-Completed Student SampleHow to Use This Product:After students have completed these guided notes, it is best for them to keep them in sheet protectors in a math folder. You can download a FREE blank table of contents
Grades:
6th
CCSS:
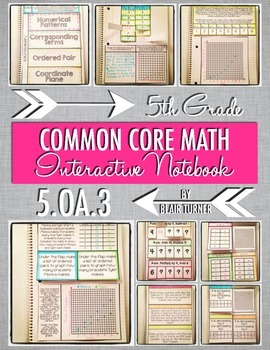
Interactive Notebook Activities - Patterns and Coordinate Planes {5.OA.3}
5th Grade Math Notebooks: Patterns / Ordered Pairs / Coordinate Planes CCSS.MATH.CONTENT.5.OA.B.3Generate two numerical patterns using two given rules. Identify apparent relationships between corresponding terms. Form ordered pairs consisting of corresponding terms from the two patterns, and graph the ordered pairs on a coordinate plane. For example, given the rule "Add 3" and the starting number 0, and given the rule "Add 6" and the starting number 0, generate terms in the resulting sequences,
Subjects:
Grades:
5th
CCSS:
Also included in: Math Interactive Notebook: 5TH GRADE ALL STANDARDS BUNDLE
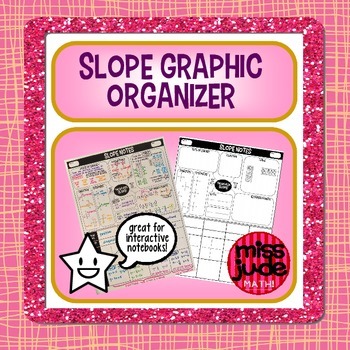
Slope Graphic Organizer Algebra
All-in-one slope notes page is intended to be used as a reference and reminder sheet for students to refer back to throughout a unit. Concepts can be added to the organizer as they are introduced throughout the unit. Includes space to record how to find slope from tables, points & an equation. Slope tells us about rate of change, the direction, and steepness of a graph. Relates types of lines, types of equations & types of slope.
Happy solving from the miss jude math! shop :)
Grades:
7th - 11th
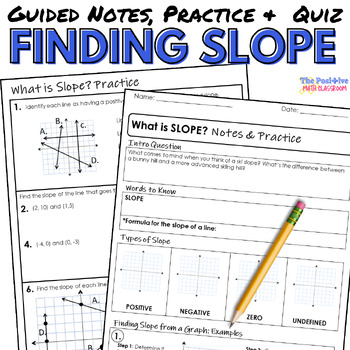
Finding Slope Guided Notes and Practice
These guided notes will be a perfect introduction to slope for your students. Print and go with these notes that will help organize your students' thinking as well as give them practice on types of slope and how to find the slope of a line. Also included is a quiz to assess students' understanding. The guided notes are organized in the following way:Intro Question: This helps your students to make a connection to new information.Words to Know: Highlights essential terms in the lesson.Examples:
Grades:
7th - 9th
Types:
Also included in: Slope and Graphing Linear Equations Bundle
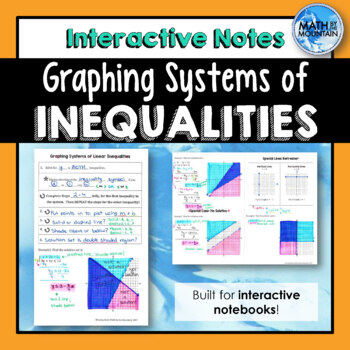
Solving Systems of Inequalities by Graphing Interactive Notebook Notes
This set of solving systems of inequalities by graphing problems comes complete with 4 examples, plus a refresher on how to graph vertical and horizontal lines! These notes are perfect for an interactive notebook (INB) and are built to reinforce prior concepts. Help your students see the process behind solving a system of linear inequalities. Explore the special case of having no solution as well as graphing with horizontal and vertical lines.All examples have been thoughtfully chosen to generat
Subjects:
Grades:
6th - 12th
CCSS:
Also included in: Unit 7 - Systems of Equations & Inequalities - Interactive Notebook Kit
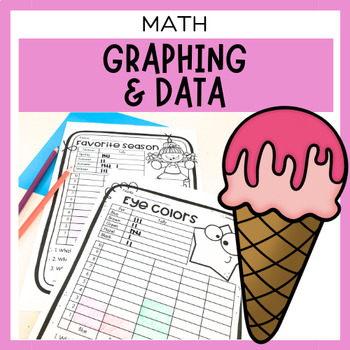
Data Analysis and Graphing Worksheets | Column Graph Activities | Tally Marks
✏️ Make learning fun and engaging for Kindergarten, first grade, and second grade students with our print-and-go graphing worksheets. From favorite ice cream flavors to class pets, your students will love collecting data and surveying their classmates to create colorful graphs. With practical data recording worksheets that utilize tally marks and column graphs, students will develop their math skills while having a blast.What's Included?Favorite ice cream flavour graphFavorite sport graphEye col
Subjects:
Grades:
K - 3rd
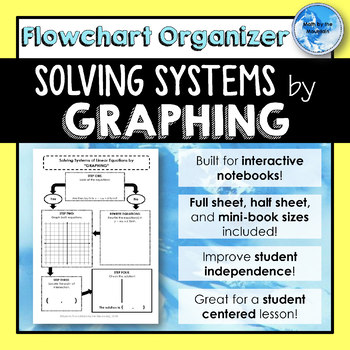
Solving Systems of Linear Equations by GRAPHING *Flowchart* Graphic Organizers
Help your students visualize the solving process for the graphing method of solving systems of linear equations. Students are able to easily lead themselves or others through a problem, even if it is their first time using this method. Includes*Solving by Graphing Flowchart Graphic Organizer (half-sheet size)*Solving by Graphing Flowchart Graphic Organizer (full-sheet size)*Solving by Graphing Flowchart Graphic Organizer (mini-book size)Half sheets and mini-books are great for interactive note
Grades:
7th - 12th
CCSS:
Also included in: Systems of Equations *Flowchart* Graphic Organizers BUNDLE
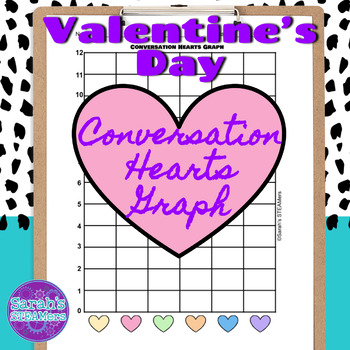
Valentine's Day Conversation Hearts Graphing Activity
What better way to incorporate math into your Valentine's Day than with a fun graphing snacktivity? This PDF contains a cover sheet, two graphs (one in color, one in B&W), and a question sheet. You can copy a graph and the question sheet back-to-back to save paper!You might also like:Sammy Cat: A Digital Escape RoomWriting Prompts Bundle2nd Grade Task Card BundleOpen The Box: Faith RinggoldPlants Mini Unit
Subjects:
Grades:
1st - 3rd
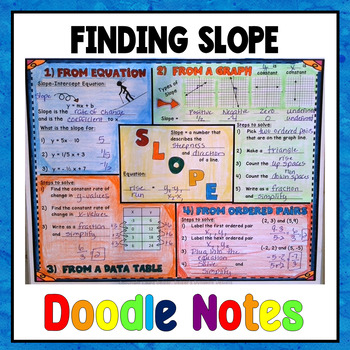
Finding Slope Doodle Notes
This Slope Doodle Notes covers finding slope from equations, graph, ordered pairs, and from data tables. Reach more students and aid in retention by using visual formats for notes and problems. We have students that are filled with anxiety about math. Doodle Notes can help diffuse anxiety for some students by allowing their artistic side to shine."Doodling has been proven to activate the brain's pathways just enough to keep it from daydreaming, without distracting from the learning at hand!
Grades:
7th - 10th

Dr. Suess Green Eggs and Ham Graphing
This is a graphing activity on Green Eggs and Ham. It also includes graphing parts for regular ham and eggs. It contains pieces to make a large class graph and cut and paste parts for students to make a graph to correspond with the class graph. As an extra bonus, there are a few fun interesting facts listed on the students graphs about Dr. Seuss. Hope you enjoy!
Subjects:
Grades:
PreK - 1st

Finding X and Y Intercepts Foldable
This foldable provides students with an introduction to what x- and y-intercepts are, as well as 6 example problems that cover finding x- and y-intercepts from graphs, tables, and linear equations. This foldable is perfect for a standalone lesson but also makes a great review or homework assignment! This foldable has been set up in a way that makes it easy to visually show the connections between finding the x- and y-intercepts from the various representations. Are you looking for other foldabl
Grades:
7th - 10th
CCSS:
Also included in: Unit 5 - Linear Functions & Slope - Interactive Notebook Kit
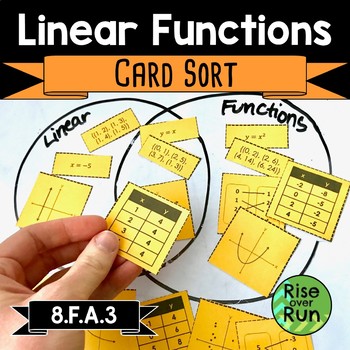
Linear Functions Card Sort Activity
Students distinguish relations as linear or non-linear, and as functions or not functions in this engaging activity.This card sort has 25 relations cards, which include tables of values, lists of ordered pairs, equations, mapping diagrams, and graphs. Two options are included for sorting: a chart or a Venn DiagramGreat for partners or groups!Answer key is included.Thank you for your interest in this resource from Rise over Run.Common Core StandardsCCSS.Math.Content.8.F.A.1Understand that a func
Grades:
8th - 9th
CCSS:
Also included in: Identifying Functions Unit with Activities, Notes, Practice, and Test
Showing 1-24 of 1,284 results


