308 results
High school statistics scaffolded note pdfs
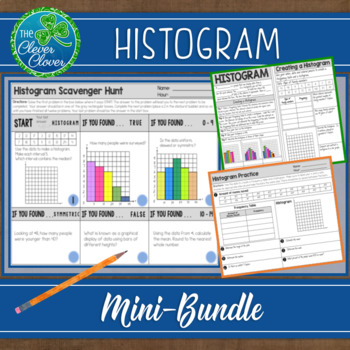
Histogram - Notes, Practice Worksheets and Scavenger Hunt
This histogram resource includes guided notes, a practice worksheet and a scavenger hunt. Your students will have the opportunity to create, interpret and discuss histograms. Below, you will find a detailed description of the notes, worksheet and scavenger hunt. Guided NotesThere are two small pages of guided notes. The first page provides the definition of a histogram and step by step instructions on how to create a histogram. The bottom portion of the notes has students examine three types (un
Subjects:
Grades:
6th - 9th, Adult Education
CCSS:
Also included in: Statistics Bundle - Guided Notes, Worksheets & Scavenger Hunts!
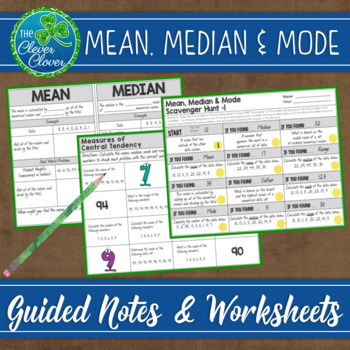
Measures of Central Tendency - Guided Notes, Worksheets and Scavenger Hunts
This resource includes guided notes, practice worksheets and two scavenger hunts on the measures of central tendency. Students will have a deep understanding of the averages, range and outliers after you implement this unit. Below you will find a detailed description of the guided notes, worksheets and the scavenger hunts.
Guided Notes
Four half pages of notes provide the definition and two practice problems for the mean, median and mode. Students will fill in key words and will calculate the
Subjects:
Grades:
6th - 9th
Also included in: Statistics Bundle - Guided Notes, Worksheets & Scavenger Hunts!
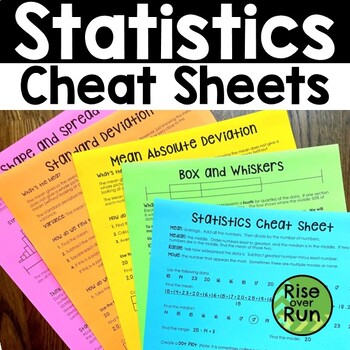
Statistics Cheat Sheets Notes with MAD, Standard Deviation, Shape & Spread
Grab these guided notes and "cheat sheets" to help your students understand statistics standards from Algebra I. Included Topics: Statistics Basics (mean, median, mode, range, dot plots, histograms, stem and leaf plots) Box and Whiskers Mean Absolute Deviation Standard Deviation Shape and Spread (Skewed Left and Skewed Right) The set includes each topic in the format of a cheat sheet and guided notes. The cheat sheets already have all the information filled in. They can be printed and given
Subjects:
Grades:
9th - 10th
Types:
CCSS:
Also included in: Algebra 1 and 8th Grade Math Curriculum Bundle for Entire Year
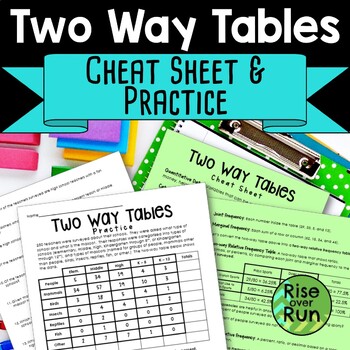
Two Way Frequency Tables Guided Notes and Practice Worksheet
Need an engaging way to get students learning about two way tables and bivariate data? This set of fill-in cheat sheets and practice helps students make sense of data and statistics represent in 2 way frequency tables. This set includes:Two Way Tables Cheat Sheets (2 Pages)These handouts have blanks to fill in with important vocabulary terms and examples of two way frequency tables. Questions are included too. This works great to fill out as a class to give students a solid foundation to und
Subjects:
Grades:
8th - 9th
CCSS:
Also included in: 8th Grade Math Activities & Lessons Bundle for the Whole Year
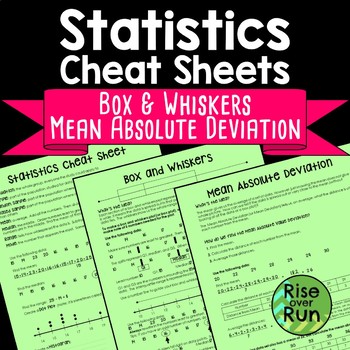
Box and Whiskers and Mean Absolute Deviation Cheat Sheets
Help students understand statistics vocabulary, dot plots, histograms, and box and whiskers diagrams, and mean absolute deviation with this resource.The three-page handout comes in two formats:Reference “Cheat Sheet” with all information filled in (pages 2-4)Guided Notes format with fill-in blanks and practice problems (pages 5-7)The first sheet defines important terms and helps students understand dot plots (or line plots) and histograms. The second sheet guides students in creating a box and w
Subjects:
Grades:
6th - 9th
Types:
CCSS:
Also included in: 7th Grade Math Activities, Lessons, Projects & More Bundle
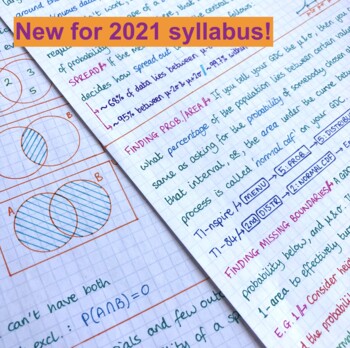
IB Math Applications & Interpretation SL - Complete Notes
Handwritten notes on the new syllabus for IBDP Math for 2021 - Applications and Interpretations SL (AI SL or A&I SL). It is 52 pages - 8 on Algebra, 10 on Functions, 8 on Trig, 17 on Statistics, 9 on Calculus.Each topic is carefully organised, with the subtopic numbers very clearly marked on each page, related to the exact numbers given in the official syllabus document.The first topic is available for free here, if you want to give it a preview before buying the whole thing.I have also fini
Subjects:
Grades:
10th - 12th
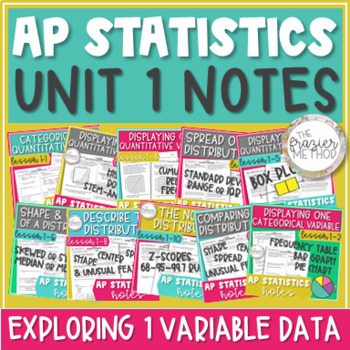
AP Statistics Notes Unit 1 Histogram, Box Plot, Skew, Mean, Normal Distribution
Use these AP® Statistics notes to teach UNIT 1 – EXPLORING ONE-VARIABLE DATA. Histograms, box plots, dot plots, stem-and-leaf plots, bar graphs, outliers, 5-number summary, z-scores, Normal Distribution / Normal Model, and describing a distribution's shape, center, & spread! Skewed or symmetric, median or mean, standard deviation or interquartile range... You can also use these notes for AP® Stats exam review! Aligns with the updated 2019-2020 objectives and standards of Unit 1: Exploring On
Subjects:
Grades:
10th - 12th
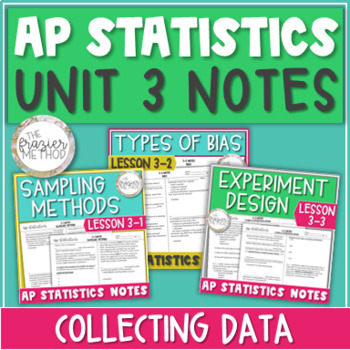
AP Statistics Notes Unit 3 Sampling Methods, Types of Bias, & Experiment Design
AP Statistics notes on SAMPLING METHODS : simple random sample, stratified sample, systematic sample, cluster sample, convenience sample... TYPES OF BIAS : undercoverage, nonresponse bias, response bias... and OBSERVATIONAL STUDIES & EXPERIMENT DESIGN : variables, treatments, control group, placebo, blocking, blinding, matched pairs, and more! Great for AP Stats Exam review! Aligns with AP College Board's updated 2019-2020 objectives and standards for AP Statistics Unit 3: Collecting Data. W
Subjects:
Grades:
10th - 12th, Higher Education
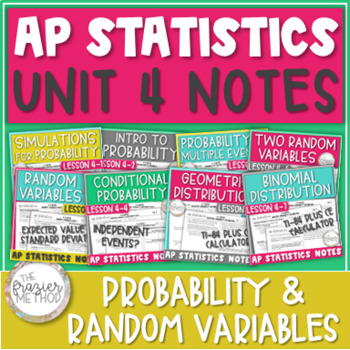
AP Statistics Notes Unit 4 Bundle - Probability Rules & Random Variables
AP Stats notes on PROBABILITY RULES : basic probability, complement, compound probability of multiple events, conditional probability, venn diagrams, simulations... RANDOM VARIABLES : expected value, standard deviation, sum and difference of two... and GEOMETRIC & BINOMIAL PROBABILITY DISTRIBUTIONS! Great for AP Statistics Exam review prep! Aligns with AP College Board's objectives and standards for AP Statistics Unit 4: Probabilities, Random Variables, & Probability Distributions. WHAT’
Subjects:
Grades:
10th - 12th
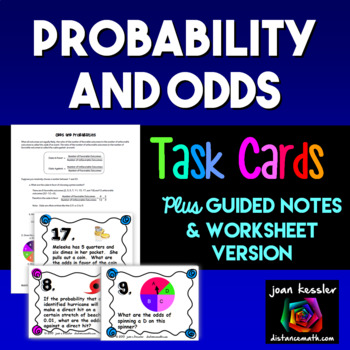
Probability and Odds Task Cards Guided Notes
This resource on Statistics: Odds and Probability is designed for Algebra or Statistics. Who doesn't get odds and probabilities confused? This set of cards and guided notes should reinforce those skills so that student will understand the difference and be able to determine simple odds and probabilities. Included: 20 Task Cards. Students determine the odds from a given situation and also determine the odds given a probability. Both odds in favor and odds against are part of the activity.Guid
Subjects:
Grades:
7th - 10th
CCSS:
Also included in: Probability and Statistics Algebra 2 Unit 11 Activity Bundle
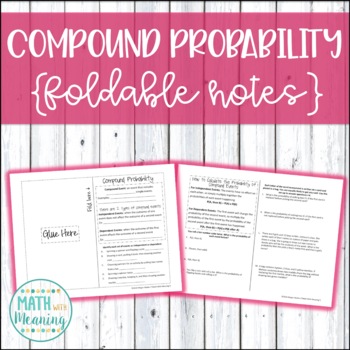
Compound Probability Foldable Notes Booklet - Aligned to CCSS 7.SP.C.8
These foldable notes are perfect for an interactive math notebook! In these notes, students will learn to whether compound events are independent or dependent and how to calculate the probability of compound events. Please view the preview file to determine if this product is appropriate for your students!An answer key is included.This activity is aligned to CCSS 7.SP.C.8.Please note that this activity is NOT editable. The text, problems, and images are not able to be changed.**Save money by buy
Subjects:
Grades:
6th - 9th
CCSS:
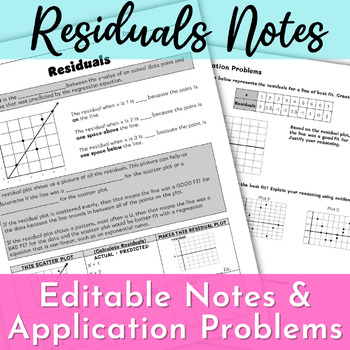
Residuals and Residual Plots for Regression Guided Notes
Students discover the connection between residual plots and assessing the fit of the linear regression with these simple notes. Students then apply their understanding to application problems that require higher order thinking.Included:PDF versionEditable Google Doc versionAnswer KeyDon't forget to leave a review so you can earn TPT credit!
Subjects:
Grades:
8th - 9th
Types:
CCSS:
Also included in: Regression Unit Bundle
Standard Deviation Activity
This activity is scaffolded at each step so they can find the standard deviation of a data set independently. The fun part is that they collect their data by recording scores of an "Are You Smarter Than A 5th Grader?" quiz! Due to the scaffolded nature of this activity, it would be perfect for distance learning with some modifications. For example, they could collect data points by quizzing parents/family members. Or you can provide data points for them. Here's how I did it:1. As a warm-up, I ga
Subjects:
Grades:
8th - 12th
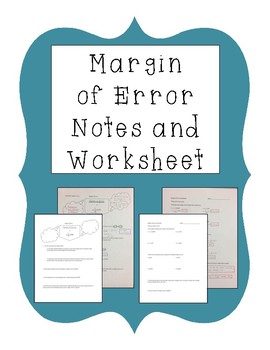
Margin of Error Notes and Worksheet
Margin of Error Notes and Worksheet is designed to help guide students in learning the basics of what a margin of error is and how to solve for it on a minimal level.
Students use a basic formula designed for a sample size and/or margin of error to solve for either the sample size or the margin of error.
Students also make inferences about margins of error when it comes to cost and time.
Blank student copy, instructions, and completed teacher copies are included.
Teacher/Instructor notes c
Subjects:
Grades:
8th - 12th
Types:
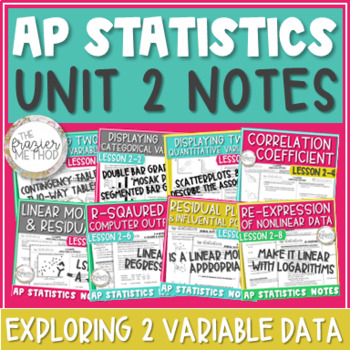
AP Statistics Notes Unit 2 Scatterplot Linear Regression Residual Two Way Table
AP® Statistics notes on UNIT 2 - EXPLORING TWO-VARIABLE DATA : contingency tables / two way tables, segmented bar graphs, scatterplots / scatter plots, correlation coefficient, linear models, residual plots, linear regression computer output, r-squared, and more! Great for AP® Stats Exam review prep! Aligns with updated 2020 objectives and standards for AP® Statistics Unit 2: Exploring Two-Variable Data. WHAT’S INCLUDED IN THIS PRODUCT?2-1 Notes - Contingency Tables2-2 Notes - Segmented Bar Grap
Subjects:
Grades:
10th - 12th
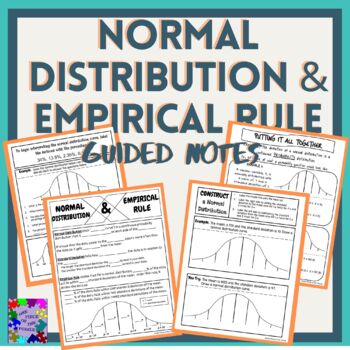
Normal Distribution and Empirical Rule Guided Notes
The guided notes provides students the definitions of normal distribution, standard deviation, and empirical rule. These concepts are explained and applied throughout the notes and building upon each other as the lesson progresses.Includes 4 page of notes and the corresponding key. This was designed to satisfy the common core standard: CCSS.HSS-ID.A.4Georgia Standard: MGSE9-12.S.ID.4
Subjects:
Grades:
11th
CCSS:
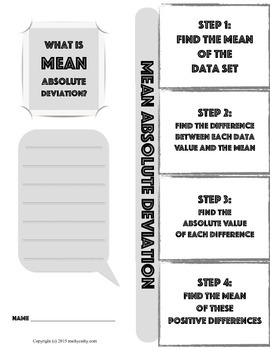
Mean Absolute Deviation Foldable Note-Taking Guide
This foldable will help make the process of learning how to calculate the mean absolute deviation of a data set easier to digest! In the new Texas TEKs, 8th grade students must be able to calculate the MAD of a small data set.
This foldable note-taking guide helps students take this process one step at a time. I encourage students to reference this structured example as they work more complex problems, and analyze the MAD of multiple data sets. This foldable guide is designed to get them s
Subjects:
Grades:
6th - 9th
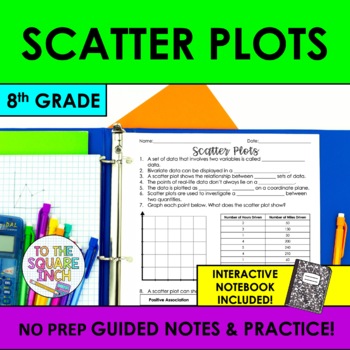
Scatter Plot Notes & Practice | Guided Notes | + Interactive Notebook Pages
Searching for an effective way to teach your students scatter plots? These NO PREP guided notes are a classroom proven resource that will save you time and have your students proficient in scatter plots in no time! With a comprehensive design, these notes offer a structured approach that can be differentiated for every level of learner. Guided notes are an effective teaching model that maximize your students ability to use working memory to focus on content, rather than copying down notes. This
Subjects:
Grades:
7th - 9th
CCSS:
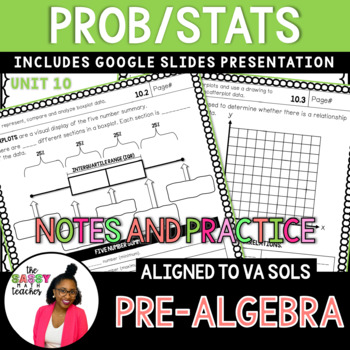
8th Grade Statistics and Probability Notes - 2016 Va Math SOLs
This 8th Grade Statistics and Probability Notes bundle is a great way to introduce your students to compound probability, boxplots and scatterplots.⭐️⭐️Full Year of 8th Grade Math Guided Notes⭐️⭐️⭐️⭐️⭐️FREE 8th Grade Math Pacing Guide⭐️⭐️⭐️Your 8th-graders will learn to distinguish between independent and dependent events along with interpreting and creating boxplots and scatterplots.The notes are perfect for binders!PLUS: At the top of each page, you will find the learning objective and space f
Subjects:
Grades:
7th - 9th
Types:
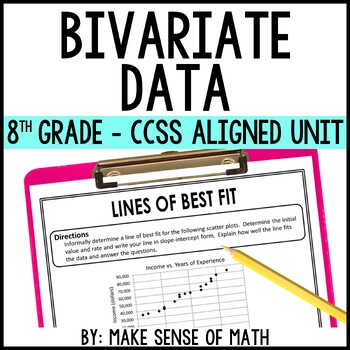
Bivariate Data Unit 8th Grade Math CCSS | Scatter Plots and Frequency Tables
This bivariate data unit includes notes, assessments, and stations. This is perfect for your students to dive into scatter plots, lines of best fit and two-way frequency tables. In-depth notes to teach and fun activities to supplement. Aligned to 8th grade math CCSSBy purchasing this bundle, you are saving more than 30% off the full value of the individual resourcesIncluded in this BundleAssessments: CCSS Aligned and Free ResponseScatter PlotsGuided NotesStationsGeometric Design Activity Google
Subjects:
Grades:
8th - 9th
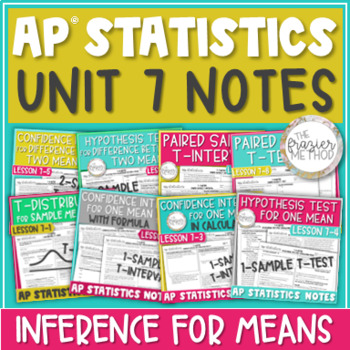
AP Statistics Notes Unit 7 Confidence Intervals & Hypothesis Tests for Means
8 AP® Statistics Notes on CONFIDENCE INTERVALS & HYPOTHESIS TESTS FOR SAMPLE MEANS. Through definitions, examples, and AP Stats FRQs, these notes teach through T-Distribution / T-Model, 1-Sample T-Interval, 1-Sample T-Test, 2-Sample T-Interval, 2-Sample T-Test, Paired Sample T-Interval, and Paired Sample T-Test. Each confidence interval and hypothesis test is taught by-hand with its formula and with its TI-84 Plus CE Calculator function. You can also use this bundle for AP® Statistics Exam p
Subjects:
Grades:
10th - 12th
Types:
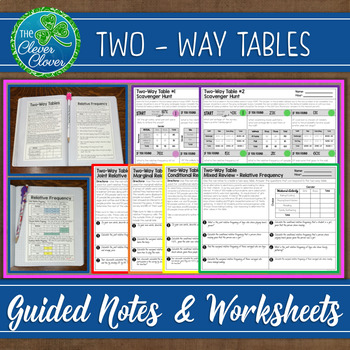
Two - Way Tables - Notes and Worksheets
This two-way table resource includes guided notes, practice worksheets and two scavenger hunts. Your students will have the opportunity to create, interpret and discuss two-way tables. Below, you will find a detailed description of the notes, worksheets and scavenger hunts.
Guided Notes
There are three half pages of guided notes on two-way tables. The first page of notes provides the definition of a two-way table. Next, students can use step by step directions on how to create a two-way table.
Subjects:
Grades:
7th - 10th
CCSS:
Also included in: Statistics Bundle - Guided Notes, Worksheets & Scavenger Hunts!
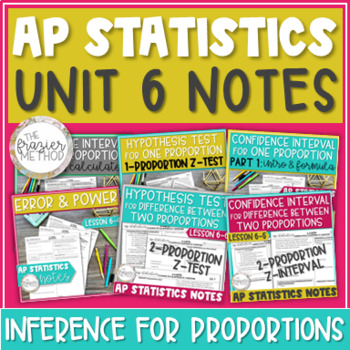
AP Statistics Unit 6 Notes Confidence Interval & Hypothesis Test for Proportions
AP Stats Notes on CONFIDENCE INTERVALS & HYPOTHESIS TESTS FOR PROPORTIONS! 1-Proportion Z-Interval, 1-Proportion Z-Test, Type 1 & 2 Errors, the Power of a Significance Test, 2-Proportion Z-Interval, and 2-Proportion Z-Test... each taught by-hand with its formula and with its TI-84 Plus CE Calculator function. Great for AP Stats Exam prep! Includes AP Stats FRQs! Aligns with AP College Board's updated 2019-2020 objectives and standards for AP Statistics Unit 6: Inference for Categorical
Subjects:
Grades:
10th - 12th
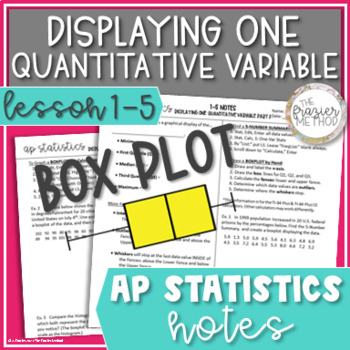
AP Statistics Notes Box Plot / Boxplot, Quartile, IQR, Outlier, 5 Number Summary
AP Stats notes to teach or review BOXPLOTS / BOX PLOTS / BOX-AND-WHISKER PLOTS! Define & calculate the median, interquartile range, 5-Number Summary, minimum, maximum, first quartile (Q1), third quartile (Q3), and percentiles for a set of data. Also, determine which data values are outliers based on the upper fence and lower fence of a boxplot. Students will graph box plots by hand given just a few of the data values and with step-by-step TI-84 Plus CE Calculator directions given the full li
Subjects:
Grades:
9th - 12th
Showing 1-24 of 308 results


