224 results
4th grade statistics resources for Microsoft Word
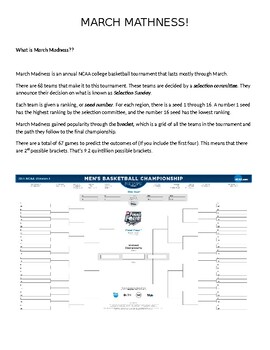
2024 March Mathness Madness NCAA Basketball Probability and Statistics Lesson
Every year I get my students excited about the NCAA Men's Basketball March Madness Tournament. I see articles written year after year from statisticians, sports journalist, celebrities, etc. about predicting the perfect bracket. Regardless that most have accepted it is nearly impossible, it has not deterred these enthusiast from finding an algorithm or a machine that can predict the outcomes.This packet guides students through 1) An explanation of what March Madness is all about2) A reading abou
Subjects:
Grades:
4th - 12th
Types:
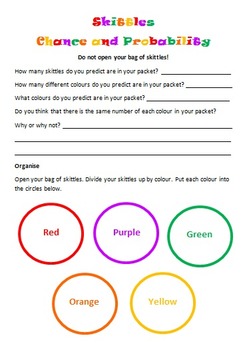
Skittles Chance and Probability (Editable)
Chance and Probability activity using yummy Skittles!!!
Students are to predict the colours and quantities before they open the skittles bag. Students are to complete a chance experiment where they use a tally to collect their data. Students then transfer their data in fractions, decimals and percentages. Students are to create a bar graph using their data as well as answer chance and probability questions about the data. I used this with my grade 5/6 students and they loved it!
Subjects:
Grades:
3rd - 10th
Types:
Create a Line Plot Project
Looking to assess line plots? Look no further!This project incorporates learning targets, skills, collaboration, and technology.Directions: With a partner, create a question used to collect data from your classmates. (Examples: In inches, how long is your hand? In cm, what is the circumference of your head? etc.) Then, create a line plot with your results. Use fraction intervals.Requirements:Create a reasonable question (Teacher approval required)Collect at least 20 pieces of dataCreate a line p
Subjects:
Grades:
4th - 6th
Types:
CCSS:
Also included in: Upper Grade Math Projects
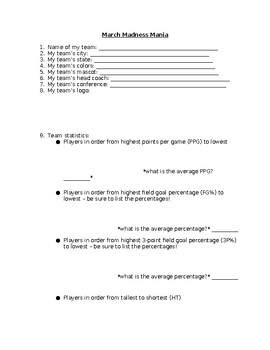
NCAA March Madness Basketball Tournament Team Research Statistics
Do you have students interested in the March Madness basketball tournament? Then this is the activity you need!To begin our March Madness unit, we look at all of the teams participating in the tournament and complete a map together to show where each team is from. We notice that some states have more than others and some states have none, and spend time discussing why that might be. Students will complete their own March Madness bracket.Students will then select a team in the NCAA March Madness
Grades:
4th - 9th
Types:
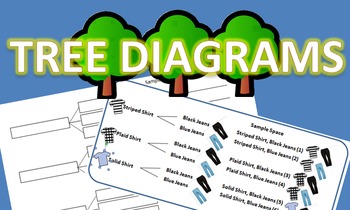
Tree Diagrams Notes and Practice Packet
I created this packet on tree diagrams for my probability unit so that students could work with one another to learn how to create a tree diagram on their own without my direct instruction. This gave me the freedom to help students that needed more individualized instruction and guidance. This packet was great to use before introducing the fundamental counting principle.
Subjects:
Grades:
4th - 9th
Types:

My Lego House
This is a 2-3 week maths project for anyone from Grade 3-6. Done in pairs or small groups the project entails students designing and building their own Lego house. In the project students will cover a range of maths concepts including area, perimeter, counting, money, graphing and interpreting data. The project includes a detailed teacher booklet with photographs of student's work and examples for each of the lessons. The student book is also included for students to work from, although we found
Subjects:
Grades:
3rd - 6th
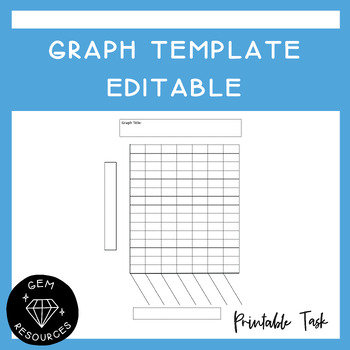
Graph Template Data and Statistics Maths Histogram Bar Column Drawing Editable
Students can use this to help them draw up a graph. It allows them to be accurate and has boxes for the titles needed for the graph.This Word document is editable.
Subjects:
Grades:
2nd - 6th
Types:
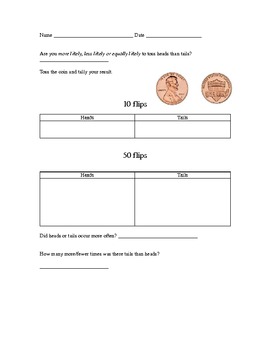
Probability: coin toss and dice roll
Teach probability using a penny and/or a dice. Introduce this probability game using key vocabulary: more likely, less likely or equally likely. Students will be able to practice using tally marks during the recording process.
Students will toss a penny 10 or 50 times and record the number of times heads or tails lands facing up. Students will roll a dice 10 or 50 times and record the number of times a even or odd number lands facing up.
Subjects:
Grades:
K - 4th
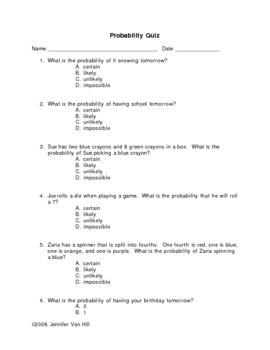
Probability Quiz
This is a probability quiz that focuses on identifying probability in the terms of certain, impossible, likely and unlikely. This quiz is in the format of of multiple choice and constructed response questions. An answer key is also provided.
Jennifer Van Hill
Subjects:
Grades:
3rd - 5th
Types:
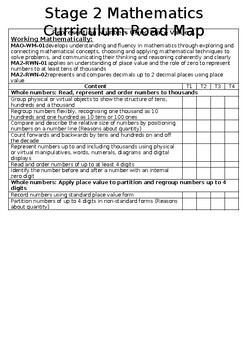
NSW STAGE 2 MATHEMATICS CURRICULUM ROADMAP (NEW K-6 SYLLABUS)
Template of a Stage 2 Roadmap for the new NSW Mathematics SyllabusThis template has a simple layout that will allow you to highlight the different Mathematic learning areas to cover throughout the year. It covers the content areas in Part A and Part B. It is organised in a way that is reflective of the live document from the NSW Curriculum website.A great tool to use for your staff planning days at the beginning of the year or each term.
Subjects:
Grades:
3rd - 4th
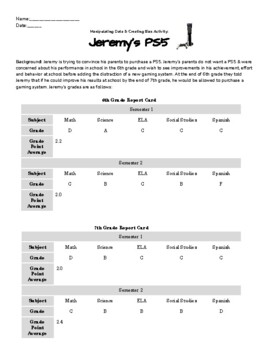
Manipulating Data & Creating Bias Activity
Manipulating Data & Creating Bias Activity: Teach your students about how charts and statistics can be skewed; and real numbers can reflect bias with this fun project! Students are given a role (either Jeremy or his parents) and have to use two pieces of data from Jeremy's 6th & 7th grade report card to argue for or against his deserving of a PS5!Students get to be creative & make cross-curricular connections to ELA as they use logical fallacies & skewed graphs to make their argu
Subjects:
Grades:
4th - 11th
Types:
CCSS:
NGSS:
HS-ETS1-4
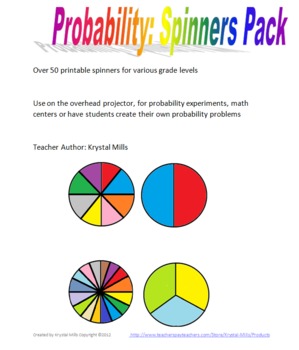
Probability Spinners Pack
This resource includes spinners for probability problems and experiments that could be used in various grades.
Included:
-blank spinners (2,3,4,5,6,8,10 and 16 spaces)
-numbered spinners (2,3,4,5,6,8, and 10 spaces)
-printable sheets (4 spinners to a page) of blank spinners with 2,3,4,5,6,8,10 and 16 spaces
-colored spinners (2,3,4,5,6,8,10 and 16 spaces)
Over 50 spinners that can be used with various grades and for various activities. Ready to print and go!
Teacher Author: Krystal Mills
pr
Subjects:
Grades:
3rd - 8th
Types:
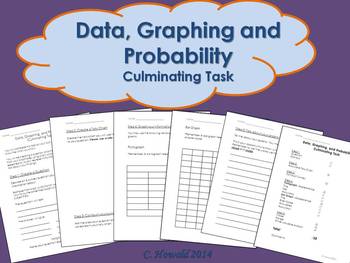
Graphing Unit Culminating Project
I used this activity as a summative assessment for my Data, Graphing and Probability Unit. This gave students the opportunity to create their own question, survey a group of students (visited another class in the school), collect, display and analyze their data.
I have left this as a .doc file so that you are able to adjust it to fit the needs of your classroom.
If you have any questions or concerns, let me know!
Thanks for downloading. Please take the time to rate this product.
If you e
Subjects:
Grades:
2nd - 4th
Types:
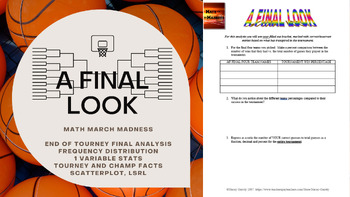
Math March Madness - A Final Look (Freq Distributions, Stats, Regression Lines)
Fill out a bracket, watch the tournament unfold and then mathematically analyze how you did! This activity is flexible enough to be used for a variety of levels. I have used all 6 pages for an AP Statistics class, and have used pages 1 through 5 for an Algebra or Algebra 2 class. You could even use it in lower levels as long as you are covering percents, and basic stats like mean, median, mode and graphing. The document is editable so you can adjust/delete to tailor to the level of statistic
Subjects:
Grades:
4th - 12th, Higher Education
Types:
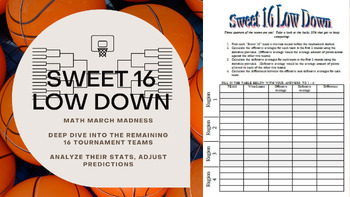
Math March Madness - Sweet 16 Low Down (Statistics Analysis of Final 16 Teams)
Join in the fun of the NCAA tournament at the Sweet 16 round! In this activity students analyze win percentages of the remaining 16 teams as well as research and compute their average offense and defense. This editable activity also asks students to analyze math presented in the real world by finding media and articles that use statistics to further their arguments.This can be used independently or check out these other items in my store for a comprehensive March Madness Project!Math March Mad
Subjects:
Grades:
4th - 12th, Higher Education
Types:
CCSS:
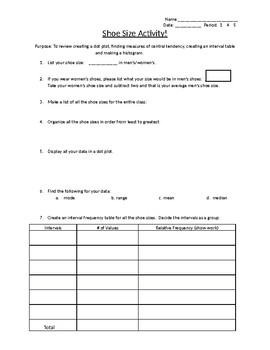
Shoe size group activity! Review dot plots and histograms.
This activity was created as a review for creating a dot plot, finding measures of central tendency, creating an interval table and making a histogram. All these items are covered in this group activity for your class! Kids enjoy working together while reviewing and learning all at one time.This is a word document that you change change anyway to fit your classes needs.
Subjects:
Grades:
3rd - 12th
Types:

Mean, Median, Range, Mode Quiz
This is a five problem math quiz. It can be used for a quiz, but also as a review. There are five sets of numbers where students must find the mean, median, range, and mode of each data set. The numbers are not in numerical order.
Subjects:
Grades:
3rd - 8th
Types:
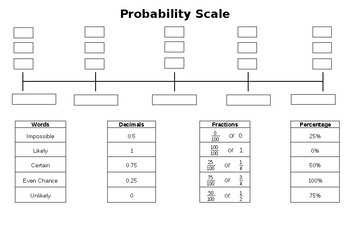
Probability Scale (Editable)
Students are to write the:
- Fractions
- Decimals
- Percentages
- Words
on the correct section of the probability scale.
Subjects:
Grades:
3rd - 8th
Types:
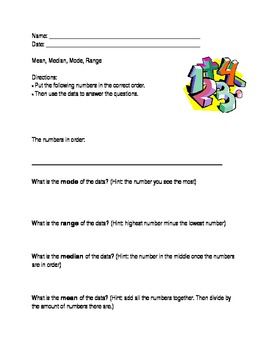
Mean, Median, Mode, Range; Modified Special Ed Math Template; Statistics
This is a modified worksheet from the middle school statistics curriculum. It is excellent for special education students who require an alternate or modified curriculum.
This worksheet allows teachers to input numbers in the blank space. This way teachers can use the template over and over with different numbers. Students are then to write the numbers in the correct order. Then, they have to find the mean, median, range, and mode. There are "hints" (formulas) that help the students differentia
Grades:
PreK - 12th
Types:

AFL Footy Maths Investigation Fractions Percentage
This task is super engaging and a practical, real-world application of fractions and percentages.
My students really grasped a good understanding of the connection between fractions and percentages as a result of this task.
Subjects:
Grades:
3rd - 6th
Types:
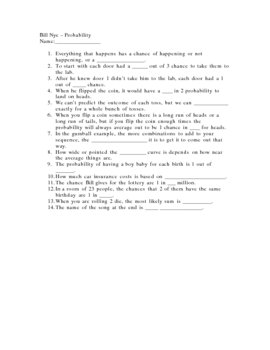
Bill Nye Probability Video Questions
This 14 question video guide with teacher key goes with the Bill Nye Probability video or DVD. This covers many examples of probability and statistics as well as the Bell curve. This could be used in a general science, physical science, biology, life science, chemistry, physics, general math or statistics class. You must have the video or DVD in order to use this product.
Attribution Non-commercial Share Alike
Please check out my other products, including more video questions. I am adding
Subjects:
Grades:
4th - 12th
Types:
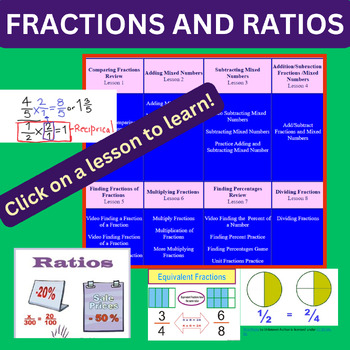
FRACTIONS and RATIOS!
By clicking a button, you and your students can access practical strategies for teaching and learning fractions and ratios while catering to diverse learning styles. Methods include interactive games, videos, and PowerPoints.This product comprises a website that strategically aligns with fractions and ratios taught in Unit 8 of Everyday Math curricula for 5th grade. Although explicitly aligned with the 5th grade Everyday Math Curriculum, this resource is adaptable for other publishers and grade
Subjects:
Grades:
4th - 6th
Types:
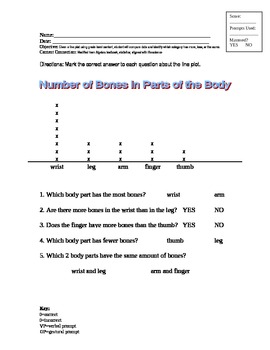
Reading a Line Plot; Modified Curriculum for Special Ed, Statistics
This line plot is modified from the middle school statistics curriculum. It is excellent for special education students who require an alternate or modified curriculum. The line plot is related to life science, and shows how many bones are in five different parts of the body. The questions on the worksheet ask questions about more and less. The answers are offered in a field of two.
This worksheet aligns with Maryland content standard:
Given a line plot using grade level content, student will c
Subjects:
Grades:
PreK - 5th
Types:
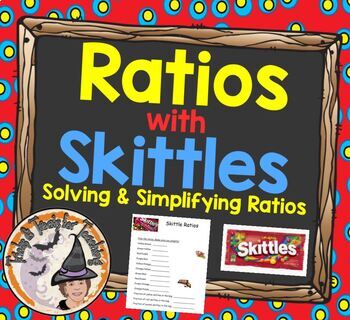
Ratios with Skittles Activity Solving and Simplifying
What student doesn't love learning something in Math while using candy as the manipulative? Solving-and-Simplifying Ratios-with-Skittles-Candy-Worksheet-Activity is a FUN worksheet to use with Skittles candy for practicing how to write and simplify ratios. You get the original, microsoft word document that is FULLY EDITABLE in case you'd like to add, delete, or edit the problems on the worksheet. You'll enjoy using this year after year!Be sure to L@@K at my other 1,285+ TERRIFIC teaching resourc
Subjects:
Grades:
4th - 7th
Types:
Also included in: Ratios Worksheets and Activities Smartboard Slides Lesson BUNDLE
Showing 1-24 of 224 results


