21 results
Kindergarten statistics resources for Microsoft Word
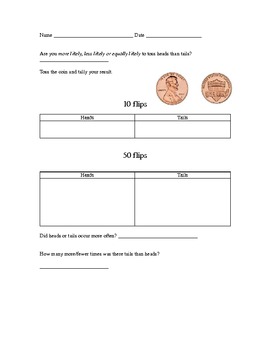
Probability: coin toss and dice roll
Teach probability using a penny and/or a dice. Introduce this probability game using key vocabulary: more likely, less likely or equally likely. Students will be able to practice using tally marks during the recording process.
Students will toss a penny 10 or 50 times and record the number of times heads or tails lands facing up. Students will roll a dice 10 or 50 times and record the number of times a even or odd number lands facing up.
Subjects:
Grades:
K - 4th
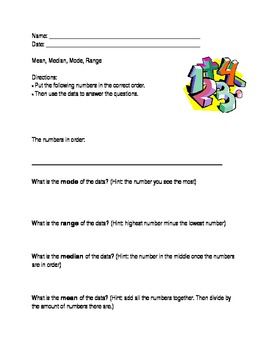
Mean, Median, Mode, Range; Modified Special Ed Math Template; Statistics
This is a modified worksheet from the middle school statistics curriculum. It is excellent for special education students who require an alternate or modified curriculum.
This worksheet allows teachers to input numbers in the blank space. This way teachers can use the template over and over with different numbers. Students are then to write the numbers in the correct order. Then, they have to find the mean, median, range, and mode. There are "hints" (formulas) that help the students differentia
Grades:
PreK - 12th
Types:
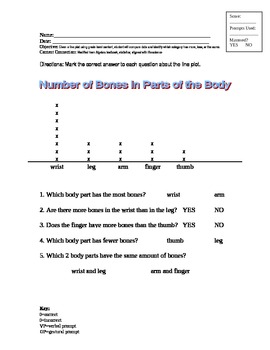
Reading a Line Plot; Modified Curriculum for Special Ed, Statistics
This line plot is modified from the middle school statistics curriculum. It is excellent for special education students who require an alternate or modified curriculum. The line plot is related to life science, and shows how many bones are in five different parts of the body. The questions on the worksheet ask questions about more and less. The answers are offered in a field of two.
This worksheet aligns with Maryland content standard:
Given a line plot using grade level content, student will c
Subjects:
Grades:
PreK - 5th
Types:
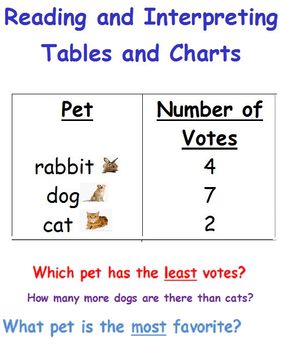
Reading a Table-Data and Statistics-First Grade
There are 4 different worksheets in which students can interpret the data of various tables. I hope they are of help to you! :)
Subjects:
Grades:
K - 3rd
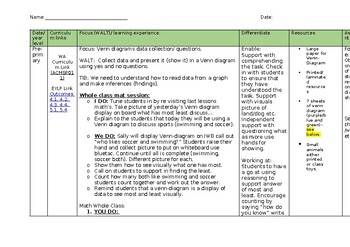
Venn Diagram lesson plan and resources
Lesson plan for teaching students how to use a Venn Diagram Pintables included for whole class and independent learning
Subjects:
Grades:
PreK - 6th
Types:
CCSS:

VicVELs Child Friendly Stats and Probability Footsteps Foundation to 6
Student friendly lists of VicVELs achievement standards for Statistics and Probability for Foundation to Level 6. These achievement standards are presented in a fun way for students and translated into child friendly language. Standards have also been broken into individual statements.
Subjects:
Grades:
PreK - 6th
Types:
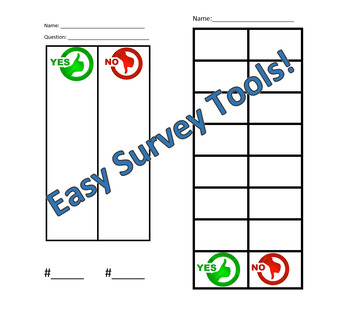
Easy Survey Tally Chart
Use this simple survey tally chart to help kids as young as 3 gather information. The chart is designed for yes or no questions.
Subjects:
Grades:
PreK - 1st
Types:
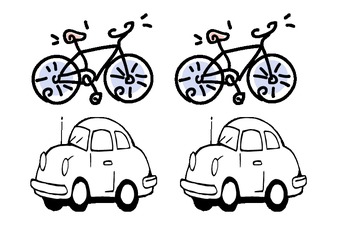
Picture Graph Pics - How the class travels to school
This is just a 4 page resource of pictures I used to introduce picture graphs to my year 1's.
There are four different pics - A bus, a car, a bike and someone walking.
I told the students that we were going to make a picture graph of how our class travels to school. We first made a tally table on the board and then students got the picture that matched their method of transport they take to school and got to colour it in. Once everyone had finished we made a big whole class picture graph.
A
Subjects:
Grades:
K - 2nd
Types:
VicVELS Statistics and Probability Achievement Standards Class Checklist
VicVELs Achievement Standards for Statistics and Probability presented in a class checklist for primary levels, foundation to level 6. Great assessment tracker tool.
Subjects:
Grades:
PreK - 6th
Types:
Two Digit Math Problems With and Without Regrouping
This math worksheet will help your students stay organized and not be overwhelmed when doing math. There is 10 pages of math problems with 6 problems on a page that is in its own text box. This help students use the count up method of doing math by identifying the biggest number and making tally marks for the smaller number. One of my students who used this math worksheet say, "I can't believe it, I can do math!"
Subjects:
Grades:
K - 5th
Types:
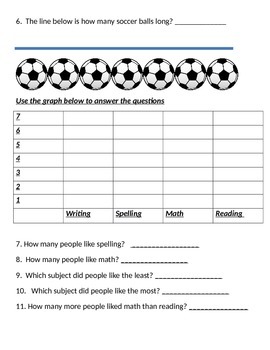
Non Standard units of measure and graphing assessment
great for homework, as well!
Subjects:
Grades:
K - 3rd
Types:
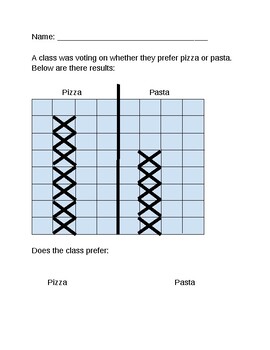
Kinder Data Exit Ticket
Use this exit ticket to assess understanding of data in a table, and comparison of quantities to answer questions.
Subjects:
Grades:
K
Types:
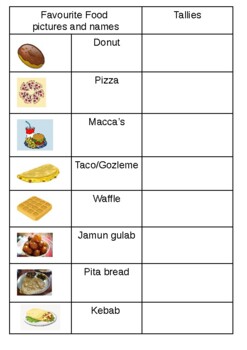
Maths - Data representation - favourite food pictograph activity cut and paste
Australian (Victorian Curriculum Year 1 and 2 levels), Maths - statistics and probability - Gathering data in a pictograph, modelling with class p.1, and task p. 2-4.Page 1 can be used as a teacher model and class data collection and pages 2-4 is the task for students that may use this for cut and paste activity to represent data using pictures for a pictograph. Foods are relatable to students of all countries.
Subjects:
Grades:
PreK - 4th
Types:

Common Core Standards for Measurement and Data for K-5
The Common Core Standards for Measurement and Data for K-5 are listed.
Subjects:
Grades:
K - 5th

Penny Toss Recording Sheet
Recording sheet for the penny toss game. Goes along with the Toss the Chips game from the Investigations math series.
Subjects:
Grades:
PreK - 2nd
Types:
Column Graphs
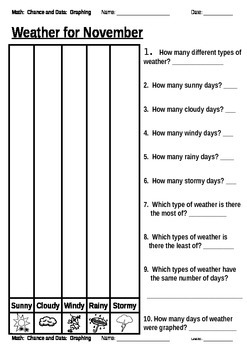
A set of three column graphs for students in Grade One. The first graph is based on weather. The second is different ways we travel to school and the third graph is about different types of animals at the zoo. The last page in the document is a set of pictures for each of the graphs. Students simply cut out all the pictures, glue them into the correct columns and then answer the 10 questions that relate to the graph.
Subjects:
Grades:
K - 1st
Types:

Autumn themed numeracy worksheets
Numeracy worksheet focusing on data handling and counting.
Subjects:
Grades:
K - 2nd
Types:

How Does First Grade get to School Graph
Use this graph during back to school so your students can compare and contrast how they get to school through graphing. Begin as a do now with a whole class chart where they sign their name under how they get to school and continue as an independent graphing activity!
Subjects:
Grades:
K - 2nd
Types:

Sochi Olympic Medal Tally
A tally chart to keep track of Olympic achievement. Can be editted to fit classroom needs.
Subjects:
Grades:
PreK - 12th
Probability Books
Integrate Math and Language Arts lessons with this annotated bibliography of great children's books to introduce probability and statistics to students.
Subjects:
Grades:
PreK - 2nd
Types:
Showing 1-21 of 21 results


