286 results
Graphing laboratories under $5
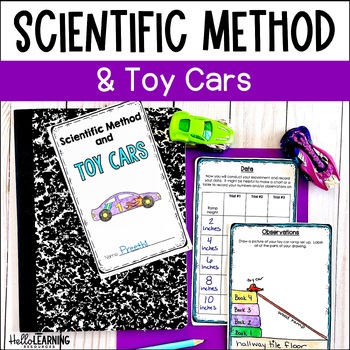
Scientific Method Activity - Easy Force and Motion Experiment for Newton's Laws
This scientific method activity gives your students an easy science experiment using toy cars to explore the steps of the scientific method. Science concepts like friction, force and motion and Newton's Laws come to life in this fun experiment!Click on the PREVIEW button above to see what is included!⭐ What is included:teacher directionssample schedule of activitiesmaterials listvocabulary cards and student vocabulary bookletdata collection and graphing sheetsworksheets for friction, force and m
Subjects:
Grades:
4th - 6th
Types:
NGSS:
3-PS2-2
, 5-PS2-1
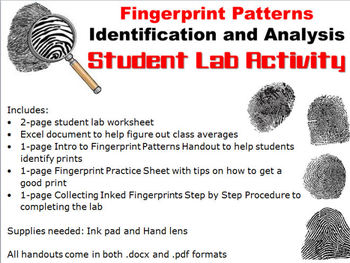
Forensic Science: Fingerprint Patterns Lab Activity
A great lab for any Forensic Science class studying fingerprints! Students learn to take fingerprints, identify fingerprint patterns, and collect class data to compare with national averages. It also helps students practice graphing.
Includes:
• 2-page student worksheet
• Excel document to help figure out class averages
• 1-page Intro to Fingerprint Patterns Handout to help students identify prints
• 1-page Fingerprint Practice Sheet with tips on how to get a good print
• 1-page Collecting Ink
Subjects:
Grades:
8th - 12th
Types:
Also included in: Forensic Science Fingerprints Unit Bundle
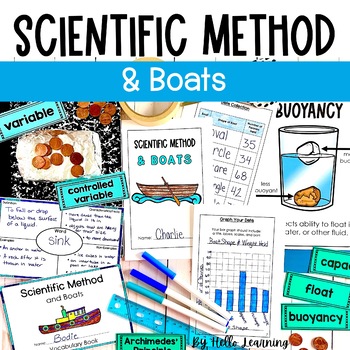
Scientific Method Experiment with Boats - Sink and Float, Buoyancy and Capacity
Students will follow the steps of the scientific method as they create tinfoil boats and learn about sink and float, buoyancy and capacity. This science experiment creates a hands on learning experience that is engaging and memorable for students!Click the green PREVIEW button to see more details of what is included.What is Included?Teacher InformationSample Schedule IdeasMaterials ListWhole Group ExperimentIndependent/Partner ExperimentExperiment Results (the science behind the experiment)Exper
Subjects:
Grades:
4th - 6th
Types:
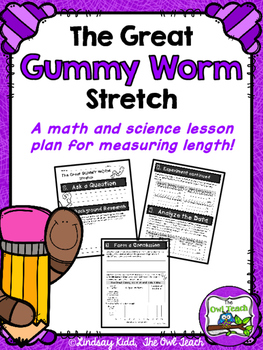
Measuring Length: {Measurement Science and Math Lab Activity}
This Measuring Length Activity is a hands-on, math and science integrated LAB, which takes students through the scientific method to measure the length of two different types of gummy worms in customary and metric units to see which type of candy worm stretches the greatest amount overall! This is easy to follow, fun, and a great way to practice measurement and data standards!
Included in this Packet:
-Teacher Directions (2 pages)
-Student Lab Sheet (4 pages)
-Grading Rubric (1 page)
Measurin
Subjects:
Grades:
1st - 4th
Types:
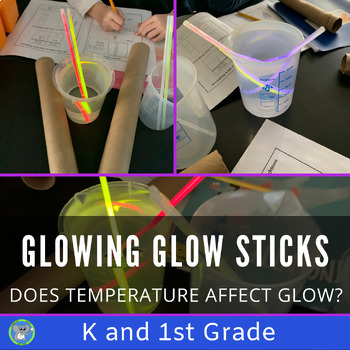
Glow Stick Light Experiment | Grade K 1 2 Chemical Reaction Science Activity
Excite students by investigating how temperature affects the brightness of glowsticks. This experiment uses simple supplies and includes detailed directions to guide the teacher and students. NGSS Aligned, fun, and perfect for Halloween.Students will follow the scientific method to answer the question:Does temperature affect the brightness of a glow stick? The journal meets the K-2 Science and Engineering Practices in NGSS.Teachers will like its’ ease of use, simple materials, and background inf
Subjects:
Grades:
K - 2nd
NGSS:
K-2-ETS1-3
, 1-PS4-2
Also included in: Chemical Reaction Bundle | The Science Of Glow Sticks | Light Activity
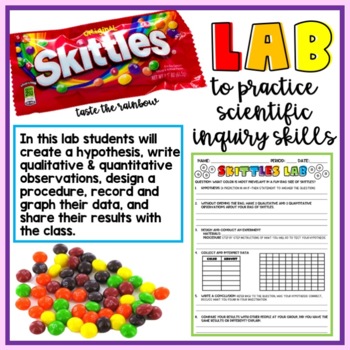
Skittles Lab: Scientific Inquiry-Scientific Method Practice
Want a fun way for students to practice scientific inquiry/ scientific method skills? This skittles lab is perfect for students practicing or reviewing how to create a hypothesis, make detailed qualitative and quantitative observations, design a step by step procedure on how to execute their experiment, graph results, and write a conclusion of their findings. There is also an opportunity to obtain class data and break down their findings by whole classes and find the percentages of what color is
Subjects:
Grades:
3rd - 8th
Types:
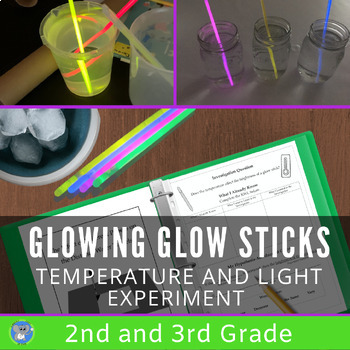
Chemical Reactions Glow Stick Science Experiment | Investigate Light | Grade 2 3
Excite students by investigating the speed of a chemical reaction using glowsticks. This experiment uses simple supplies, includes detailed directions to guide the teacher and students, and creates a memorable experience. NGSS Aligned, fun, and perfect for Halloween.Students will learn about chemiluminescence and chemical reactions. They will use data and observations to write a conclusion. Students will follow the scientific method to answer the question: Does temperature affect the brightne
Subjects:
Grades:
2nd - 5th
Types:
NGSS:
3-5-ETS1-3
, 2-PS1-4
, 2-PS1-1
, 2-PS1-3
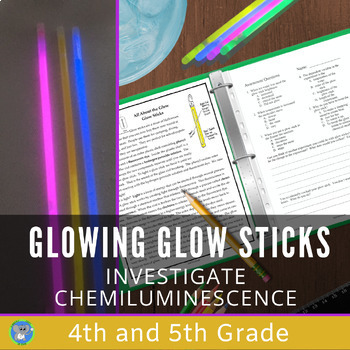
Chemical Reactions Glow Stick Science | Investigate Light | Grade 4 5
Excite students by using glowsticks to investigate chemiluminescence and the speed of a chemical reaction. This experiment uses simple supplies, includes detailed directions to guide the teacher and students, and creates a memorable experience. NGSS Aligned, fun, and perfect for Halloween.Students will discover chemiluminescence and the speed of a chemical reaction. They will follow the scientific method to answer the question: Does temperature affect the brightness of a glow stick? The journal
Subjects:
Grades:
4th - 6th
NGSS:
5-PS1-3
, 3-5-ETS1-3
, 4-PS3-3
, 5-PS1-1
, 4-PS3-2
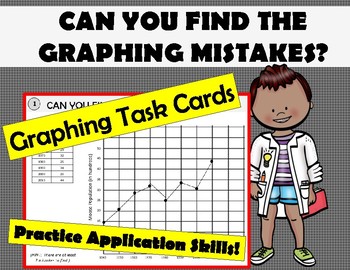
Can you find the LINE GRAPHING MISTAKES? 8 Graph Task Cards Application
Have you spent some time teaching graphing? Are students making the same mistakes over and over? Have them catch the mistakes with this task card activity.This product consists of 8 task cards; each with a set of data and a line graph that is graphed incorrectly (with at least 2 mistakes). Students need to find the mistake on each one!This can be done as a stations activity, a whole group lesson or as a pass game. As an enrichment for early finishers, included is a sheet for students to make
Subjects:
Grades:
5th - 10th
Types:
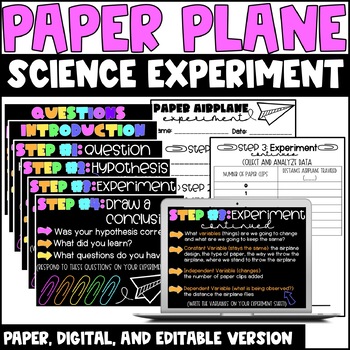
Scientific Method Paper Airplane Experiment | Digital | Editable | No Prep
Before my students delve deep into the Science curriculum, I ensure they have a clear understanding for the Scientific Method. This Paper Airplane Experiment allows children to explore the Scientific Method as they practice collecting and analyzing data from controlled, independent, and dependent variables. So...HOW DOES IT WORK? Students will fly a paper airplane and compare the distance it traveled to the distance that same paper airplane traveled when paper clips are added. PSA: the airplane
Subjects:
Grades:
3rd - 8th
Types:
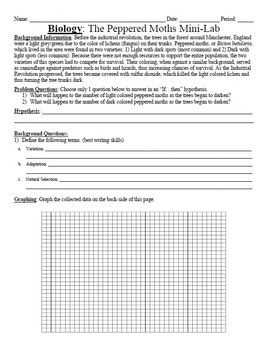
Natural Selection Peppered Moth data analysis
Students will examine data from the historical peppered moth experiment and answer several analysis questions and create a graph of the data. This is a great way to reinforce the concept of natural selection as the population sizes of two Peppered moths increase and decrease as the environment changes.Three items in this download:1) Peppered moth analysis (Word)2) Peppered moth analysis (pdf)3) Answer key for the peppered moth analysis (Word)Here are a few other Evolution-based lessons:Natural S
Subjects:
Grades:
6th - 12th
Types:
Scientific Method Activity | Water Science Experiments
Students will learn about the scientific method as they conduct science experiments exploring water. They will learn about concepts like solubility, surface tension, and heat transfer using the steps of the scientific method.This resource includes three (3) great experiments following the scientific method using water to teach the scientific concepts of:Surface TensionWater MoleculesCohesion and AdhesionHeat TransferSolubilityEach experiment can be done in a more guided environment or more indep
Subjects:
Grades:
4th - 6th
Types:
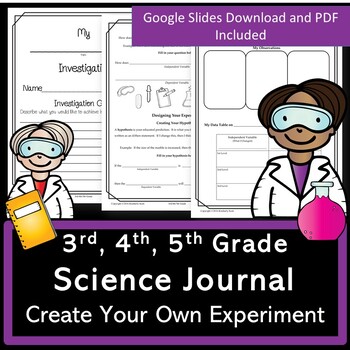
Science Experiment Journal Template | Digital Or Print | Grades 3 4 5
Are you looking to create hands-on investigations with your upper elementary students? Help students think like a scientist using a lab report template. Included are a student-editable Google Slide document and a PDF version. We will take you step by step in designing unique experiments on the topic of your choice. A Google Slide version is included. We feel this journal is great to assign students to perform an experiment at home. During this time of digital learning, students can use suppli
Subjects:
Grades:
3rd - 6th
NGSS:
3-5-ETS1-3
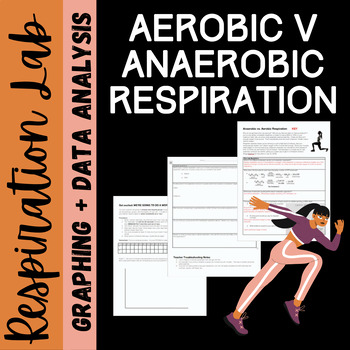
Anaerobic vs. Aerobic Respiration Lab
This lab asks students to pick a muscle group and push it to the point of anaerobic respiration. Students should have background knowledge before beginning this. This activity can be done using only a stop watch to time reps (sit-ups, push ups, etc.), but I like to borrow hand weights, yoga balls or pilates bands from the gym for extra fun. Kids really get into this activity!I have uploaded this in a .docx format, so you can edit and differentiate for your classroom and students' needs. Enjo
Grades:
7th - 12th
Types:
NGSS:
HS-LS1-7
Also included in: Photosynthesis and Respiration Bundle
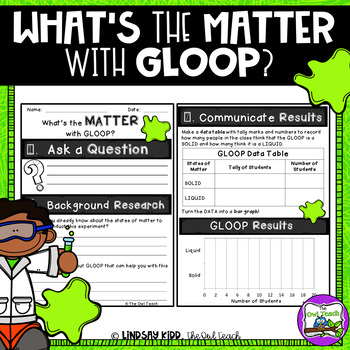
States of Matter Unit Integrated Lab Activity
This is the perfect lesson to use for your students to show you what they know about the states of MATTER. In this integrated lesson activity, students will make GLOOP and determine if the substance is a solid or liquid, supporting their opinion with scientific evidence! This includes a story elements map to correlate with a children's book, teacher instructions, student lab sheet (following the scientific method), and a student data collection page (math correlation).States of Matter GLOOP Lab
Subjects:
Grades:
2nd - 5th
Types:
Also included in: States of Matter Unit BUNDLE
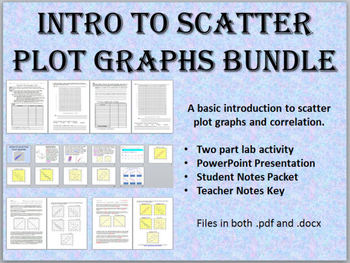
Introduction to Scatter Plot Graphs Bundle - Lab, Notes, PowerPoint Presentation
This Intro To Scatter Plot Graphs bundle contains:
• Intro to Scatter Plot Notes (2-page fill-in style student version and 2-page teacher version)
• PowerPoint Presentation (11 slides)
• Scatter Plot Lab Activity (4 pages)
• Files in both .pdf and .docx. PowerPoint is .ppt
This bundle contains a basic introduction to scatter plot graphs and correlation (perfect positive, perfect negative, high positive, low positive, high negative, low negative, and no correlation). Also includes a link to pra
Grades:
7th - 10th
Types:
Water Bottle Flipping Investigation
Water bottle flipping- ratio, percent, measurement, data collection and graphing! The kids love bottle flipping and this product will let you bring bottle flipping into your classroom in an educational way!
Students will make predictions about the ideal water level in their water bottle that will result int he most successful flips. They will then record data about their bottle and conduct a variety of trials using different water levels to test their success with flipping their bottle at d
Subjects:
Grades:
5th - 7th
Types:
Scientific Process LOLLIPOP LAB Experiment-Measure, Graph, Data Chart, 100th Day
Have a fun and yummy time reviewing the steps of the Scientific Method! I do this science inquiry candy lab with my classes to introduce to review the steps of the Scientific Process as we gear up for our Science Fair.
This is a 4-page lab that takes 2-3 lab periods of about 45 minutes, depending on the age and experience of your kids. I've included 4 versions for you. (See the PREVIEW for one full version.)
I teach 4th and 5th grade classes of different sizes, so I use all 4 versions... two v
Subjects:
Grades:
4th - 6th
Types:
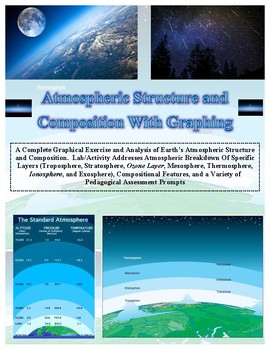
Atmospheric Layers Structure and Graphing LAB (An Earth Science Favorite!)
PROCEEDS BENEFIT "REACH INC."-EMPOWERING ADULTS WITH DISABILITIES
http://www.reachinc.org
Great COMBINATION of both math and science! This is an updated version by Southern Science Specialists.
New content, assessment prompts, and graphical template.
---------------------------------------------------------------------------------------------------------
See the "Extended Version" that additionally addresses the atmospheres of other planets found at the link below
CLICK HERE FOR EXTENDED VER
Subjects:
Grades:
5th - 10th, Adult Education
Types:
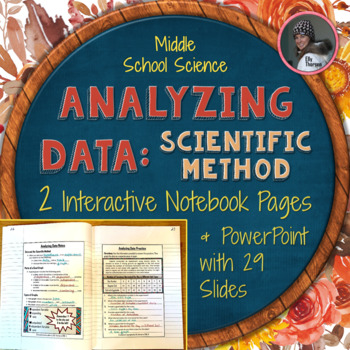
Analyzing Data Interactive Notebook Pages & PowerPoint for the Scientific Method
This middle school science resource has two interactive notebook pages and a 29 slide PowerPoint about analyzing data and making good graphs in the scientific method. The INB pages and PowerPoint emphasize these important graphing concepts:a title that's a combination of the independent and dependent variablesan x-axis label that contains the independent variablea y-axis label that contains the dependent variableaccurate intervals on graphsthe purposes and uses of bar graphs, line graphs, and pi
Subjects:
Grades:
5th - 8th
NGSS:
MS-ETS1-3
Also included in: Scientific Method Interactive Notebook Pages and PowerPoint BUNDLE
Lima Bean Experiment
Students will grow a Lima Bean in a ziplock bag to answer the question, "What does a plant need to grow?". The project takes 7-10 days and includes activities like observing, recording data, measurement, graphing, and predicting. Students love growing something of their own and taking it home to their families.
Subjects:
Grades:
1st - 3rd
Types:
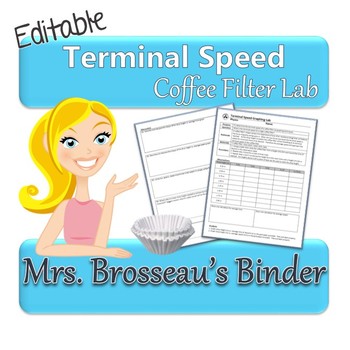
Terminal Speed Physics Lab & Graphing Activity using Coffee Filters {EDITABLE}
Do you want a teach your students about terminal speed, but can't find the time to put together a complex lab and then mark it all?
This is the lab for you!
This is part of my cost-saving, amazing Physics Bundle!
This is a quick lab that your students can complete start to finish in one class period. The student handout pages include:
• Purpose
• Question
• Rationale
• Materials
• Procedure
• Observation Table
• Graphing and Follow-up Questions + Conclusion
You'll need:
• meter stick
• coff
Grades:
7th - 12th
Types:
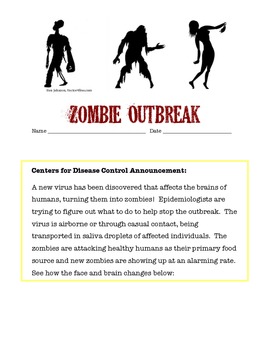
Investigating the Spread of a Viral Outbreak
Students in grades 5 - 9 model the spread of an infectious disease under the entertaining theme of a zombie outbreak. One student unknowingly is patient zero and students simulate the spread of an airborne illness. This highly engaging activity covers health topics, nature of science, and math skills as students graph data in a line plot. Higher level students can be challenged to find the function of the exponential growth of the outbreak.
Subjects:
Grades:
6th - 9th
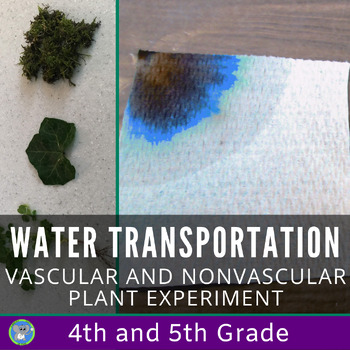
Vascular and Nonvascular Plants | Water Transportation | Grade 4 5 Science
Discover the differences in vascular and nonvascular plants in this complete unit. Students will explore color chromatography and how plants transport water at the same time. Uses simple supplies,meets the Science and Engineering Practices, and helps develop academic language in science. Includes lesson plans, investigation journal, teacher guide, and assessment. Digital and Distance Learning Approved. This is a great way to get students to use the scientific method at home. The supplies are
Subjects:
Grades:
4th - 6th
NGSS:
4-LS1-1
, 3-5-ETS1-3
, 5-LS1-1
Showing 1-24 of 286 results


