18 results
5th grade statistics laboratories

Candy Probability: Discovery of EXPERIMENTAL vs. THEORETICAL Probability
Middle Schoolers LOVE probability!
This is a GREAT lesson around Halloween when the kids are already hyped up on sugar and want to 'talk' to their classmates.
This activity allows the students to DISCOVER the differences between EXPERIMENTAL and THEORETICAL probability and connect it to everyday experiences. The probability lesson lends itself to fractions, decimals, percents, data collection, rational & irrational numbers, statistical graphs (box and whiskers, frequency tables...), measu
Subjects:
Grades:
5th - 9th
Types:
Water Bottle Flipping Investigation
Water bottle flipping- ratio, percent, measurement, data collection and graphing! The kids love bottle flipping and this product will let you bring bottle flipping into your classroom in an educational way!
Students will make predictions about the ideal water level in their water bottle that will result int he most successful flips. They will then record data about their bottle and conduct a variety of trials using different water levels to test their success with flipping their bottle at d
Subjects:
Grades:
5th - 7th
Types:
Spring into Statistics Data Displays and Measures of Center Lab
This is a hands-on lab that teaches about Statistical Questions, Data Displays (dot/line plot, histograms, box plots) and Measures of Center (mean, median, mode, and range). The lab includes notes pages, examples with answer keys, and a final project in which the student can survey classmates and create a "flower" by using their data to find mean, median, mode, range. They will also create a box plot, histogram and dot plot.
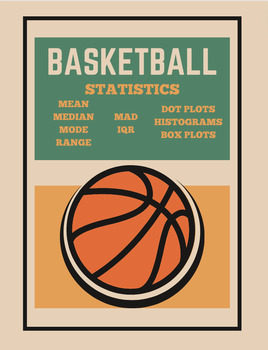
Basketball Statistics Project
Description: Engage your middle school students in the exciting world of basketball while reinforcing math and data analysis skills with this interactive Basketball Stats Project! This comprehensive resource is designed to captivate students' interest in both sports and mathematics, making learning both fun and meaningful.Take your students to the gym or outdoor playground hoop and they'll collect data on "How many baskets can ___ graders make in 60 seconds?" (the template is set to sixth grade
Subjects:
Grades:
5th - 8th
Types:
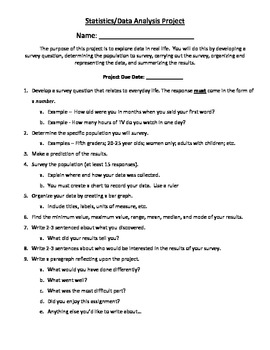
Real-Life Statistics Project
Students must think of a survey question that can be answered numerically. Then, they must go out into their community or school and ask at least 15 people their question. After collecting their data, they must find the minimum, maximum, range, mean, median, and mode. Also, they must graph their results, and answer a few reflection questions about their data.
I have my kids put all of this information on a poster or make a powerpoint presentation to show the class. I find this activity re
Subjects:
Grades:
4th - 8th
Types:
Water Filtration
Students are challenged to filter contaminated water for safe consumption using their own designs. 3D print and non-3D print options included. Students will also experience a complete engineering design process, collect and analyze data, and will share their results and finally reflect on their experience. Teacher and student instructions included. Developed by a team of engineers and teachers.
Subjects:
Grades:
PreK - 5th
Types:
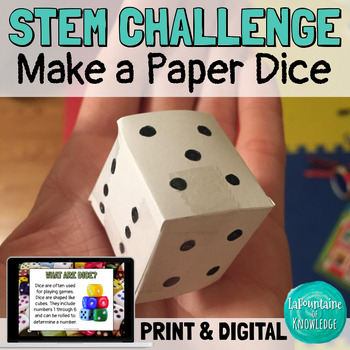
STEM Challenge Make a Paper Dice Geometry Lab Experiment PRINT and DIGITAL
In this STEM challenge, students create and test a paper die. They learn about dice and how their cube shape allows them to land on random numbers each time they are rolled. This hands on science lab activity incorporates geometry (3D shapes) and probability with engineering and design. This resource includes: teacher directions, discussion questions, and extension activitiesbackground information about dice and how they workan introduction to the challenge to get students starteda student respo
Subjects:
Grades:
3rd - 6th
Types:
NGSS:
3-5-ETS1-3
, 3-5-ETS1-1
, 3-5-ETS1-2
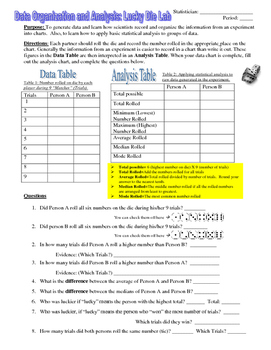
Data Organization and Statistical Analysis Activity: Lucky Die Lab
An engaging way for students to learn about how scientists generate data and make meaning of that data using statistical tools. Featured Concepts:Data Organization in TablesData Analysis Using Measures of Central Tendency: Mean, Median and Mode. NGSS Science and Engineering Practice: Using mathematics and computational thinkingMaterials needed in addition to the handouts: Dice (one per student dyad)Includes bonus second page featuring analysis of experimental design, with opportunities for fur
Subjects:
Grades:
5th - 8th
Types:
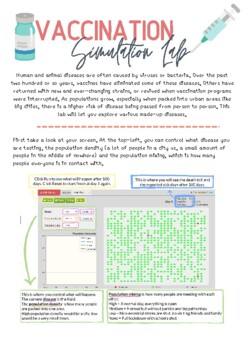
COVID-19 Simulation Lab
Students go to the following website and follow the guide to answer the questions. They look specifically at why social distancing and staying at home works, how population density affects the spread of a virus and how vaccinations can slow the spread. They will answer questions about their thoughts on vaccinations and if they should be required to have one. Website: https://www.learner.org/wp-content/interactive/envsci/disease/disease.html
Grades:
5th - 12th
Types:
NGSS:
HS-LS4-6
, HS-LS4-3
, MS-LS4-4
, MS-LS4-6
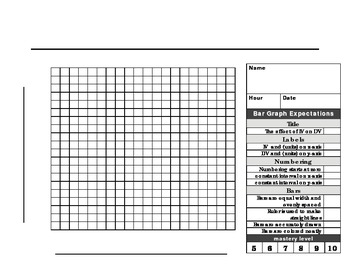
Bar Graph paper and rubric
This 20 X 20 graph paper with rubric is made for a beginner scientist to make a the perfect BAR graph. The checklist format makes it easy for students to know what is expected when graphing. Enjoy!
Subjects:
Grades:
1st - 12th, Higher Education, Adult Education
Types:
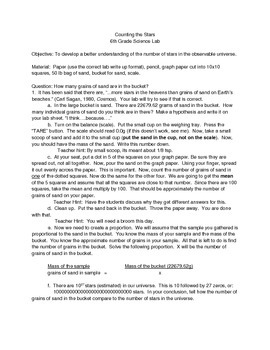
Counting the Stars in the Universe
How many stars are there? I was asked this many times. I developed a lab for 6th graders that would allow them to get an idea about how big that number is. This lab fits the NGSS Scientific and Engineering Practices, " Developing and Using Models", Analyzing and Interpreting Data", "Using Mathematics and Computational Thinking" It also meets the following Crosscutting Concepts: "Scale, Proportion and Quantity", "Systems and System Models".
Subjects:
Grades:
5th - 6th
Types:
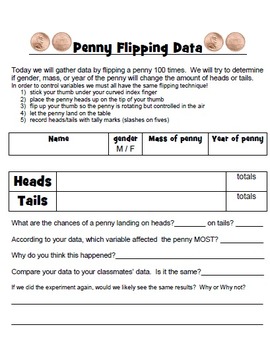
Flipping Pennies to Gather Raw Data
This record sheet will help your students gather raw data in the form of heads or tails. Use this data to look for patterns and then add up the class data to compare to. Discussion topics include percentages, chance, and cause/effect relationships.
Subjects:
Grades:
2nd - 9th
Types:
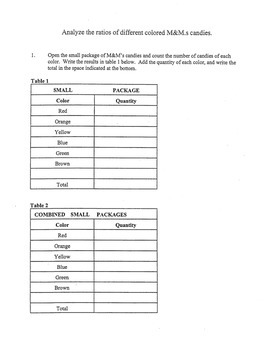
General Math: Analyze M&M's Stats Lab
This is a fun lab where students analyze the number of M&M's in the individual size packets. They gather stats and predict the number of each color in a 32oz bag. Done in groups, this is a good learning lab for mean, median and mode as well as gathering data. Students will also gain insight into writing and sharing observations.
Subjects:
Grades:
5th - 9th
Types:
Statistics Math Lab
PLEASE MAKE SURE YOU ARE ABLE TO ACCESS GOOGLE DOCS BEFORE PURCHASING THIS MATH LAB!!!
I will be making updates as feedback comes in, so check back to the link often!
This is a fun lesson that takes between 90-120 minutes. I have 45 minute periods and with my 6th graders in a class of 24, we were able to gather all of our data and have 10 minutes to spare. The next day, we finished the calculations and the visuals. Some worked faster than others, so some of the kids got to the reflection quest
Subjects:
Grades:
5th - 7th
Types:
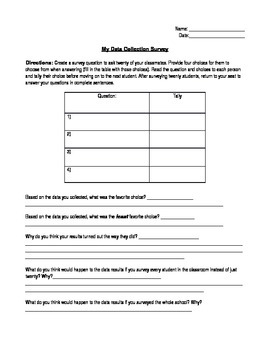
Data Collection Survey
This is a short survey where students are in charge of coming up with a question and surveying their classmates. They fill in the data as they collect it and analyze the data by answer questions at the end. It would be great at the beginning of the scientific method unit.
Subjects:
Grades:
3rd - 5th
Types:

Take a Spin Math Lab
Have students pair up and use 2 spinners (0-9) to complete this math lab activity.
Subjects:
Grades:
5th - 7th
Types:

Probability Class Review
This review has questions on one side and the answers on the other. When hung around the room, students can work through the problems at their own pace and are able to check their answers.
Subjects:
Grades:
5th - 8th
Types:
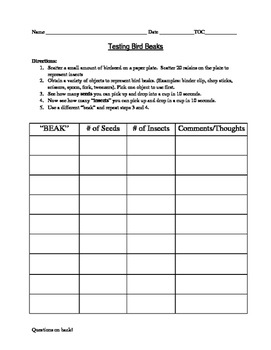
Bird Beak Variation Lab
This lab is a great inquiry activity demonstrating variation in bird beaks. This relates directly to instruction involving Darwin, natural selection, and variation.
Subjects:
Grades:
5th - 9th
Types:
Showing 1-18 of 18 results


