133 results
6th grade statistics study guides
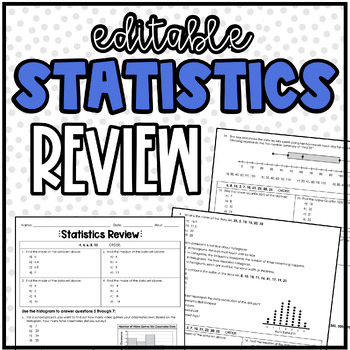
Statistics Review (Editable) | 6th Grade Math
Editable Statistics Review:I use this review with my sixth grade students at the end of our unit. This review includes a variety of types of questions! With my resources, I like to leave space and room for the students to show their work - which is provided in this resource!Topics Covered:Mean, Median, Mode, and RangeIdentifying Outliers in a Data SetFinding the MAD (Mean Absolute Deviation) Understanding HistogramsUnderstanding Dot PlotsUnderstanding Box Plots (Lower Quartile, Upper Quartile, I
Subjects:
Grades:
6th - 8th
Types:
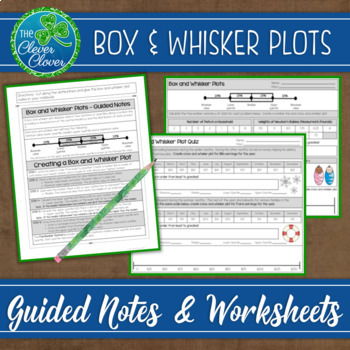
Box and Whisker Plots: Notes, Worksheets and an Assessment
This resource includes detailed step by step notes on how to create a box and whisker plot, a worksheet and an assessment.
The notes include step by step instructions that can be referenced as students study box plots. Students can glue the notes directly into their notebooks. A box and whisker plot visual is used to display the four quartiles of data. As students complete each step, they will determine the five-number summary used to create a box and whisker plot. The guided notes address
Subjects:
Grades:
6th - 9th
Also included in: Statistics Bundle - Guided Notes, Worksheets & Scavenger Hunts!
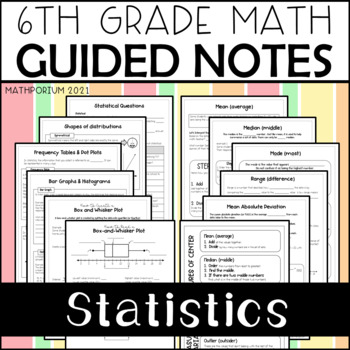
Statistics Guided Notes
These guided notes are a great resource for teaching statistics. You can print them for students to have as reference, upload to your class page, or even create a math reference board in your classroom. The pages are perforated to fit into a spiral notebook.They are a great accommodation for students with special needs. They minimize writing to allow your students to focus on listening and learning. They shorten your lessons, freeing up time for other activities. You can even send the answer key
Subjects:
Grades:
6th
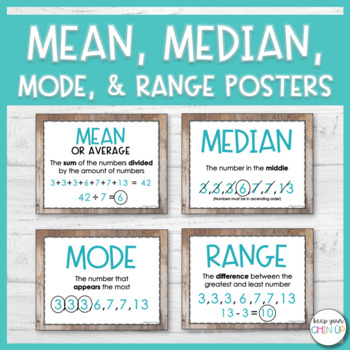
Mean, Median, Mode, and Range Posters
Looking for a visual to help your students with determining the mean, median, mode, and range of a data set? These simple posters are designed to help your students remember key words and formulas for each of the terms.
WHAT'S INCLUDED?
► 2 Options for printing (color or black & white)
► Posters for the terms: mean, median, mode, range, and data set
► Vocabulary worksheet
► Practice worksheet
Subjects:
Grades:
4th - 6th
Types:
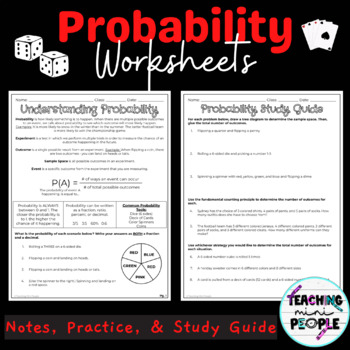
7th Grade Probability Worksheets
In this Percentage Worksheet Set, students learn and practice with probability. There are notes and practice problems on each probability topic, as well as a 32 question study guide for practice. Students work with experimental and theoretical probability, compound events, tree diagrams, and so much more. This set is perfect for in class notes, math centers, remediation, sub plans, or extra credit. What’s Included:➜ 10 Worksheets of Notes & Practice➜ 3 Page Study GuideTopics Included:➜ Under
Subjects:
Grades:
6th - 7th
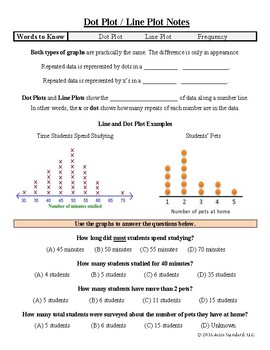
Dot Plots and Data Distribution Notes
A visually appealing and interactive way to teach about dot plots, line plots and the distribution of data. Both reading and creating dot/line plots is addressed on the first page of the notes. The entire second page is dedicated to describing the shape of the data. From bell curves to skewed left or right, dot plots are used to describe statistical elements of data sets.
Actis Standard notes are a great way to teach students how to take notes in an easy to follow fill-in-the-blank format. Comp
Subjects:
Grades:
5th - 7th
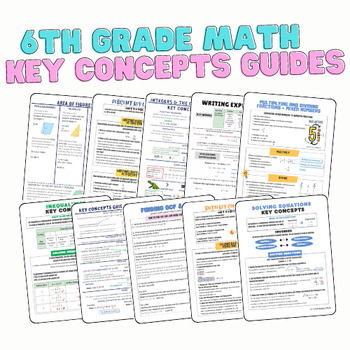
6th Grade Math: Key Concepts Guides/Anchor Charts BUNDLE
Give your students the KEY to success by purchasing this key concepts guides/anchor charts bundle. This bundle is a MUST HAVE resource for 6th grade classrooms and would also be a great one for 7th grade classrooms to have the important foundations to grow their knowledge! This bundle includes guides for ALMOST ALL 6th grade common core standards with just a few that are not addressed such as multiplying and dividing decimals using standard algorithm.Purchasing as a bundle saves you $7.50!The to
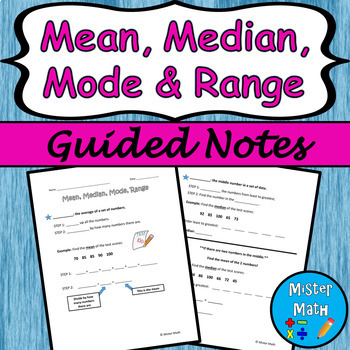
Mean, Median, Mode & Range Guided Notes
This is a guided notes resource to assist students in learning about finding the mean, median, mode, and range of data sets. The guided notes include definitions, as well as a guided example for each skill. An independent practice worksheet is included that asks students to find the mean, median, mode and range for four data sets (for a total of 16 extra practice problems!) An answer key is also provided.This Guided Notes packet is also part of a BUNDLE that includes a PowerPoint presentation to
Subjects:
Grades:
3rd - 6th
Also included in: Mean, Median, Mode & Range PPT and Guided Notes BUNDLE
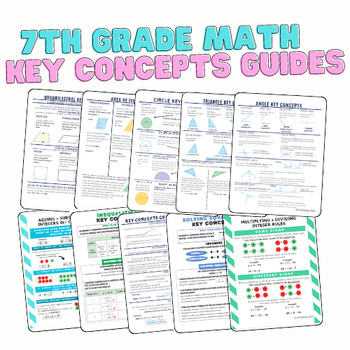
7th Grade Key Concepts Guides/Anchor Charts: BUNDLE
Give your students the KEY to success by purchasing this key concepts guides/anchor charts bundle. This bundle is a MUST HAVE resource for 7th grade classrooms and would also be a great one for 8th grade classrooms to have the important foundations to grow their knowledge!Purchasing as a bundle saves you $7.00!The topics included in this bundle are:1. Adding and Subtracting Integers2. Multiplying and Dividing Integers3. Solving and Writing Equations4. Solving and Graphing Inequalities5. Circles:
Subjects:
Grades:
6th - 8th
Types:
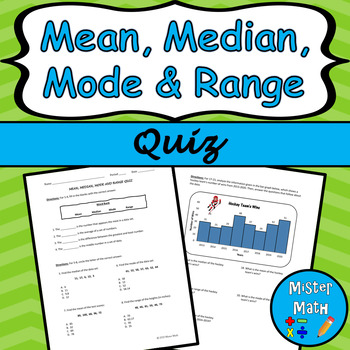
Mean, Median, Mode & Range Quiz
Assess your students' knowledge and skills in finding mean, median, mode and range with this 21-question quiz! The quiz includes fill-in-the-blank, multiple choice, and open-response questions, as well as real-life applications. Students will also be asked to analyze data tables and a bar chart, and calculate the mean, median, mode and range of each data set. An optional challenge activity is included, in which students will be asked to create a data set of their own, place that data into a tabl
Subjects:
Grades:
3rd - 6th
Also included in: Mean, Median, Mode & Range MEGA BUNDLE
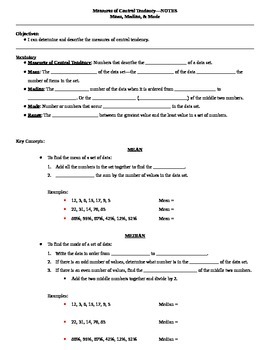
Measures of Central Tendency Guided Notes
These are guided notes for a lesson on measures of central tendency including mean, median, mode, and range. There are several examples in the notes and the same data sets are used to show each measure of central tendency.I have also included a teacher key to show you what to fill in the blanks as your students follow along.To use these notes, I simply projected them onto my whiteboard, gave the students their blank copies, and had them follow along and write what I wrote. This works great when
Subjects:
Grades:
5th - 12th
CCSS:
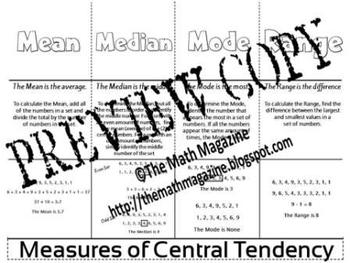
Measures of Central Tendency Mean Median Mode Foldable 6.SP.A.1, 7.SP.1, S-ID.2
Measures of Central Tendency Mean Median Mode Foldable 6.SP.A.1-3, 7.SP.1-4, S-ID.2
This is a single page PDF foldable that explains the Measures of Central Tendency: Mean, Median, Mode and Range.
The foldable includes: the definition of each term, an explanation of the correct ways to determine each and an example of each.
The folding directions are included with the purchased file.
BONUS: (2) FREE ITEMS are included as my way of thanking you for your interest in my items.
Follow me on T
Grades:
5th - 12th, Adult Education
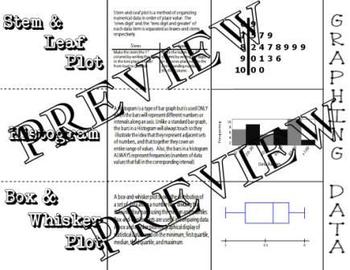
Graphing Data Histogram Box Whisker Stem Leaf Plot Foldable Interactive Notebook
Graphing Data Histogram Box Whisker Stem Leaf Plot Foldable Interactive Notebook
This is a single page PDF foldable that explains the differences in Histograms, Box and Whisker Plots and Stem and Leaf Plots, as well as shows an example of each.
The folding directions are included.
All feedback is welcomed
Follow Me on TpT!
Subjects:
Grades:
4th - 12th, Adult Education
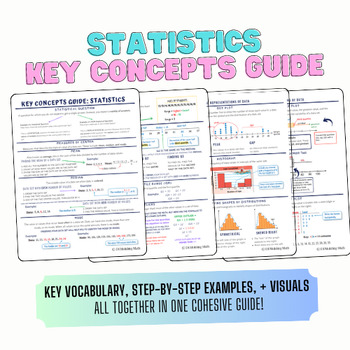
Statistics: Key Concepts Guide
This guide includes info on statistical questions, mean, median, mode, range, quartiles, interquartile range, outliers, dot plots, box-and-whisker plots, stem-and-leaf plots, shape distribution, and histograms!Give students the KEY to success with this cohesive four-page key concepts guide for your statistics unit!As a teacher, I know the struggles of making sure students come prepared with their notes or take notes that are legible and usable. After creating this resource I have seen huge incre
Subjects:
Grades:
5th - 8th
Also included in: 6th Grade Math: Key Concepts Guides/Anchor Charts BUNDLE
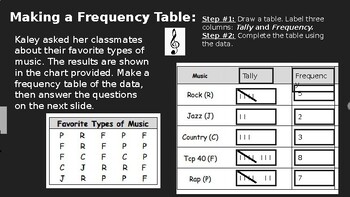
Frequency Tables and Histograms Assignment/Practice Questions
This is a PowerPoint that can be used as practice problems (classwork or homework) to help understand data through frequency tables and histograms. These notes align with the EnVisions Math textbook for topic 8, lesson 4 but can be used separately as well! (Delete the yellow "answer key" clip art along with any answers on each slide before assigning students their copy!) Document can be downloaded and edited as needed.
Subjects:
Grades:
5th - 8th
Types:
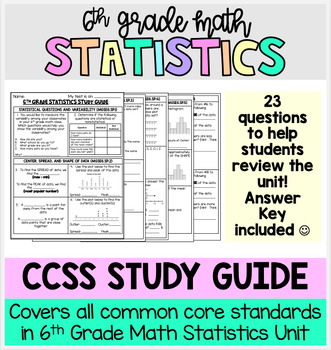
6th Grade Statistics Unit Review Study Guide
This is a 23 question study guide that reviews all ccss in the 6th grade statistics unit. I use this to help review and prepare my students for their end of unit test, which covers all standards. This is a great way to check for mastery right before testing. This can also be use to review for state testing at the end of the year. Let me know how it works for you and if you have any questions! :)
Subjects:
Grades:
5th - 7th

Stem and Leaf Plot Foldable
Included is a foldable on stem & leaf plots. Students can use the foldable to help them study for a test. This is a great hands on activity for any grade level learning about stem and leaf plots.Students will be given some data. They will need to organize the data and create a stem & leaf plot. They will determine the mean, median, mode, and range of the given data.There are 2 versions: (1) Fill-In and (2) Already Filled-In. You can decide to use whichever version you prefer.
Subjects:
Grades:
5th - 7th
Also included in: Math Foldables Bundle (Includes All Math Wheel Foldables)
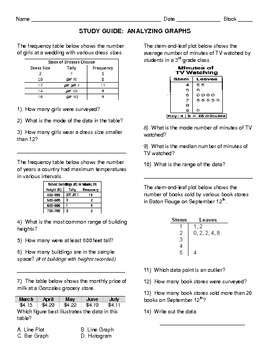
CCSS 6.SP Analyzing Data Study Guide
Common Core State Standards addressed: 6.SP.2, 6.SP.3, 6.SP.4, 6.SP.5a, 6.SP.5cThis 26-question study guide requires students to read, create, or analyze a frequency table, a stem-and-leaf plot, a scatter plot, a line plot, a bar graph, a line graph, and a histogram. Students consider outliers, the measures of central tendency (mean, median, and mode), as well as the measure of variation (range), to analyze and draw conclusions about data displayed in various tables and graphs.
Subjects:
Grades:
5th - 8th
Types:
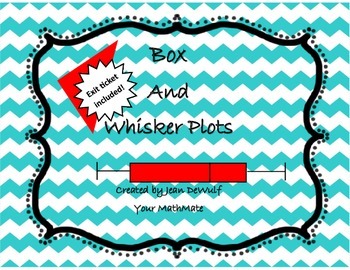
Box and Whisker Plot Foldable/Brochure Exit Ticket Included
Students will be engaged with this interactive brochure as they learn about box-n-whisker plots. You can use this brochure to introduce box-n-whisker plots or as a review. Students will be able to glue this resource into their journals/notebook for future use. This is the perfect resource for students who require guided notes. Exit Ticket Included. Answer Keys included.
Topics Include:
Vocabulary Section: box-n-whiskers plots, median, quartiles, quartile 1, quartile 2, quartile 3, inte
Subjects:
Grades:
5th - 8th
CCSS:
Common Core – 6th grade – Data & Statistics Review Booklet
This 8-page review booklet was designed to provide students a detailed review of the standards under the Data and Statistics strand of the 6th Grade Common Core Standards. This resource includes notes and practice questions for the topics including: types of distribution, measures of center, measures of spread, mean absolute deviation (MAD), line plots, histograms, and box-and-whisker plots.
At the end of the review booklet, there are 20 multiple choice test style questions. It is a great way f
Subjects:
Grades:
5th - 8th
Types:
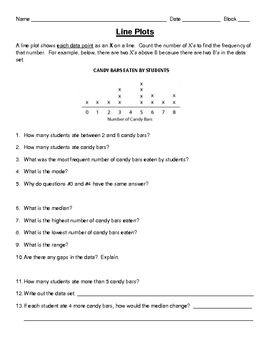
CCSS 6.SP.4 6.SP.5 Analyzing Line Plots
This document requires students to analyze line plots in order to determine measures of central tendency, as well as range and gaps. Students are asked to match listed data with data displayed in a line plot. Other questions include how the median would be affected if there was a change in the data.
Subjects:
Grades:
5th - 8th
Types:

Unit 9 - Data Representations - Worksheets - 7th Grade Math TEKS
Data Representations Worksheets that align to the TEKS!
This bundle pack contains Homework, Quizzes, Study Guide, and a Unit Test to supplement TEKS 7.6G and 7.12A-C!
Topics Covered:
• Proportion Review
• Measures of Center
• Dot Plots
• Comparing Dot Plots
• Box Plots
• Comparing Box Plots
• Summarizing Categorical Data
• Analyzing Categorical Data
• Inferences from a Random Sample
• Comparing Populations
Main Features:
★ 19 - Worksheets - 9 Homework Assignments & 10 Quizzes - Includes
Subjects:
Grades:
6th - 8th
Types:
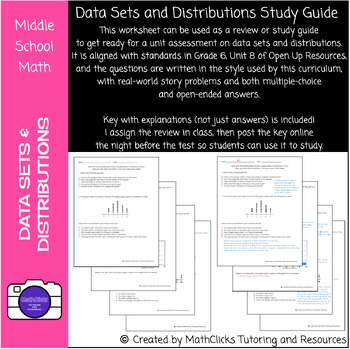
Data Sets and Distributions Study Guide (Eureka and Open Up Style)
This worksheet can be used as a review or study guide to get ready for a unit assessment on data sets and distributions. It is aligned with standards in Grade 6, Unit 8 of Open Up Resources, and the questions are written in the style used by this curriculum, with real-world story problems and both multiple-choice and open-ended answers. Key with explanations (not just answers) is included! I assign the review in class, then post the key online the night before the test so students can use i
Subjects:
Grades:
5th - 7th
Types:
Everyday Math Grade 6 Unit 1 Review
Unit 1 review for 6th grade EDM. Revised 9/30/19.Created 2016-2017 school year.
Subjects:
Grades:
6th
Types:
Showing 1-24 of 133 results


