1,047 results
Middle school statistics handouts
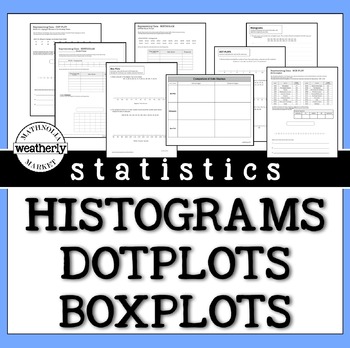
STATISTICS - Histograms, Dot Plots and Box Plots
There is no need to scour the internet for data. This resource includes the data and the format to challenge your students' skills with data displays.This packet includes worksheets that provide opportunities for students to create histograms, dot plots, and box plots.They can be used as guided practice or as "on your own" activities.INCLUDES3 worksheets with realistic data.3 worksheets with REAL data (Apple stock prices, US Olympic athlete ages, and the Oscars:Best Picture/ Movie Times)AND 3 wo
Subjects:
Grades:
6th - 9th
Types:
CCSS:
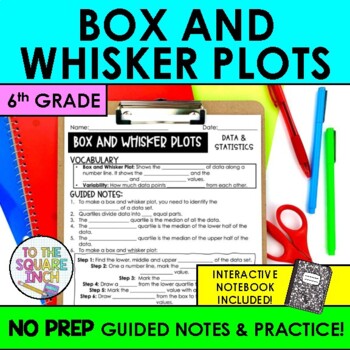
Box and Whisker Plot Notes & Practice | Box Plot Diagram Guided Notes
Searching for an effective way to teach your students how to make and interpret box and whisker plots? These NO PREP guided notes are a classroom proven resource that will save you time and have your students proficient in box and whisker plot in no time! With a comprehensive design, these notes offer a structured approach that can be differentiated for every level of learner. Guided notes are an effective teaching model that maximize your students ability to use working memory to focus on conte
Subjects:
Grades:
5th - 7th
CCSS:
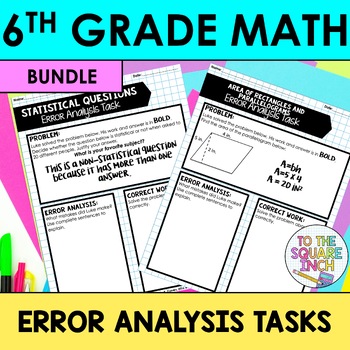
6th Grade Math Error Analysis
6th Grade Math Error Analysis Tasks - One task for each Common Core Standard70 different error analysis tasks for each 6th Grade Common Core Standard. This is a bundle of 5 different products at over a 20% discount. Please click on each link to see individual product descriptions. The Number System Topics include: Multiplying FractionsDividing FractionsDividing Mixed NumbersAdding and Subtracting DecimalsMultiplying DecimalsDividing Decimals by Whole NumbersDividing Decimals by DecimalsGreatest
Subjects:
Grades:
5th - 7th
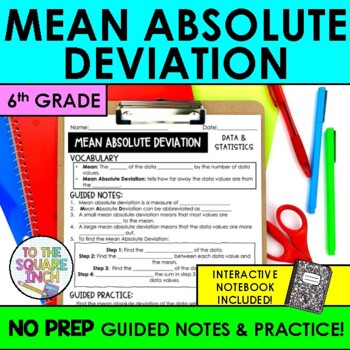
Mean Absolute Deviation Notes | MAD Guided Notes + Interactive Notebook Pages
Searching for an effective way to teach your students how to find mean absolute deviation? These NO PREP guided notes are a classroom proven resource that will save you time and have your students proficient in mean absolute deviation in no time! With a comprehensive design, these notes offer a structured approach that can be differentiated for every level of learner. Guided notes are an effective teaching model that maximize your students ability to use working memory to focus on content, rathe
Subjects:
Grades:
5th - 7th
CCSS:
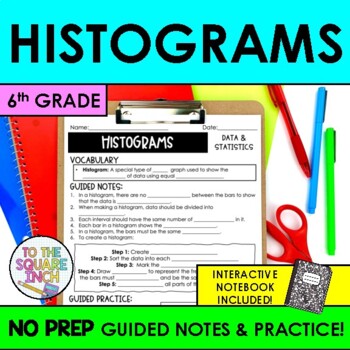
Histograms Notes & Practice | Guided Notes for Histogram Data Displays
Searching for an effective way to teach your students how to read histrograms? These NO PREP guided notes are a classroom proven resource that will save you time and have your students proficient in histograms in no time! With a comprehensive design, these notes offer a structured approach that can be differentiated for every level of learner. Guided notes are an effective teaching model that maximize your students ability to use working memory to focus on content, rather than copying down notes
Subjects:
Grades:
5th - 7th
CCSS:
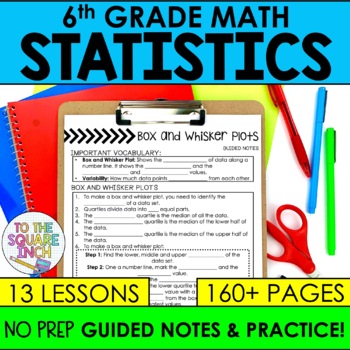
6th Grade Statistics and Probability Notes & Activities Unit | Data Sets
Looking for 6th grade guided notes for Statistics and Probability that are designed to help your students thrive and save you the time and energy of writing and designing them yourself? These NO PREP guided notes are a classroom-proven resource that will have your students proficient in entire 6th Grade Math statistics and probability common core standards. With a comprehensive design, these notes offer a structured approach that can be differentiated for every level of learner for the entire u
Subjects:
Grades:
5th - 7th
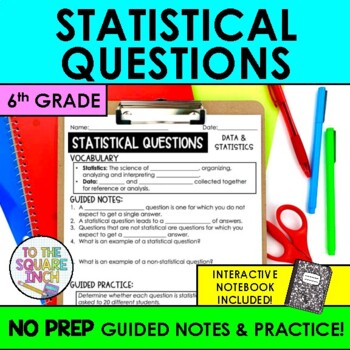
Statistical Questions Notes & Practice | Guided Notes + Interactive Notebook
Searching for an effective way to teach your students statistical questions? These NO PREP guided notes are a classroom proven resource that will save you time and have your students proficient in statistical questions in no time! With a comprehensive design, these notes offer a structured approach that can be differentiated for every level of learner. Guided notes are an effective teaching model that maximize your students ability to use working memory to focus on content, rather than copying d
Subjects:
Grades:
5th - 7th
CCSS:
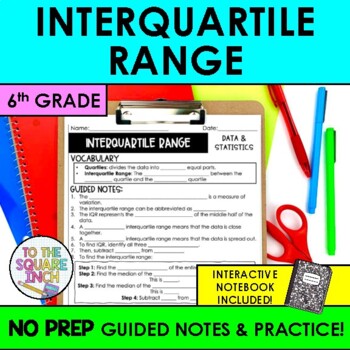
Interquartile Range Notes & Practice | IQR Notes for 6th Grade Math
Searching for an effective way to teach your students how to find interquartile range? These NO PREP guided notes are a classroom proven resource that will save you time and have your students proficient in interquartile range in no time! With a comprehensive design, these notes offer a structured approach that can be differentiated for every level of learner. Guided notes are an effective teaching model that maximize your students ability to use working memory to focus on content, rather than c
Subjects:
Grades:
5th - 7th
CCSS:

Experimental and Theoretical Probability Notes
This file contains notes on theoretical and experimental probability. The page contains the meaning of each type of probability, a number cube, a spinner, data of an experimental, and practice problems. The page asks students to compare the two types of probabilities and encourages a discussion about notices and wonders. If you are unfamiliar with my notes, feel free to download the free file for Integer Introduction Notes as well as many other notes for purchase.Thank you for looking!
Subjects:
Grades:
5th - 8th
Types:
Shapes of Distributions Notes & Practice | Data Displays & Distributions
Searching for an effective way to teach your students how to read shapes of distributions? These NO PREP guided notes are a classroom proven resource that will save you time and have your students proficient in shapes of distributions in no time! With a comprehensive design, these notes offer a structured approach that can be differentiated for every level of learner. Guided notes are an effective teaching model that maximize your students ability to use working memory to focus on content, rathe
Subjects:
Grades:
5th - 7th
CCSS:
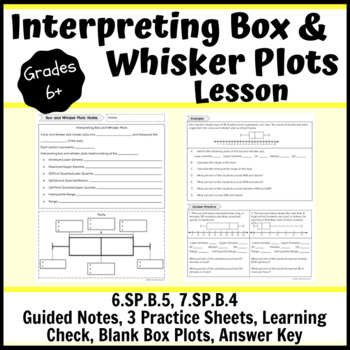
Interpreting Box and Whisker Plots Lesson- Notes, Practice, Learning Check
This interpreting box and whisker plots lesson consists of a guided notes sheet, 3 practice sheets, a learning check, 2 different half sheets of blank box plots and an answer key. You can hole punch the note pages and have students place them in their binders or a 3-prong folder. There are teacher notes to guide you through the direct instruction with students. There are three pages of practice. One page can be used as independent practice when students are ready; this could be in class or homew
Subjects:
Grades:
6th - 10th
Types:
Statistics & Data Display Project for 6th Grade Math PBL (Fully Editable)
This product includes a student guide for a 6th grade middle school mathematics project that will require students to develop a statistical question, conduct a survey with their classmates, create numerical summaries, represent their findings using visual data displays, and finally present their findings! The thorough student guide provides step by step directions for each part of the project and could be used as either an in class project or to be assigned as homework. The student guide also in
Stem and Leaf Plot Notes & Practice | + Interactive Notebook Pages
Searching for an effective way to teach your students how to read and interpret stem and leaf plots? These NO PREP guided notes are a classroom proven resource that will save you time and have your students proficient in interpreting stem and leaf plot in no time! With a comprehensive design, these notes offer a structured approach that can be differentiated for every level of learner. Guided notes are an effective teaching model that maximize your students ability to use working memory to focus
Subjects:
Grades:
5th - 7th
CCSS:
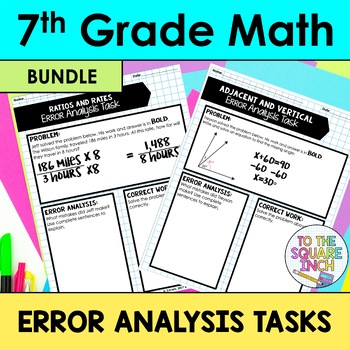
7th Grade Math Error Analysis Task Bundle
7th Grade Math Error Analysis Tasks- One task for each Common Core Standard*60 different error analysis tasks for each 7th Grade Common Core Standard. This is a bundle of 5 different products at over a 20% discount. Please click on each link to see individual product descriptions. The Number System Topics include: Terminating and Repeating DecimalsAdding Integers with Different SignsAdding Integers with the Same SignAdding Rational NumbersMultiplying IntegersDividing IntegersMultiplying Rational
Subjects:
Grades:
6th - 8th
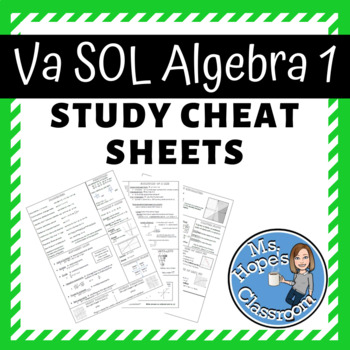
Algebra 1 Review Cheat Sheet for SOL!
REVIEW SHEETS THAT INCLUDE THE FOLLOWING TOPICS:Coordinate PlaneDirect and Inverse VariationDomain and RangeEquations of a LineExponent LawsFactoringFunctionsGraphing InequalitiesLine and Curve of Best FitMultiplying PolynomialsPropertiesQuadraticsScatter plotsSlope and GraphingSquare and Cube RootsSystems of EquationsI give this sheet to my students as we prepare for the SOL tests so that if they get stuck, they can refer to the sheet to help jog their memory.Calculator instructions for various
Subjects:
Grades:
7th - 11th
Types:
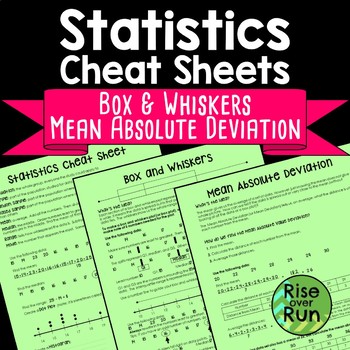
Box and Whiskers and Mean Absolute Deviation Cheat Sheets
Help students understand statistics vocabulary, dot plots, histograms, and box and whiskers diagrams, and mean absolute deviation with this resource.The three-page handout comes in two formats:Reference “Cheat Sheet” with all information filled in (pages 2-4)Guided Notes format with fill-in blanks and practice problems (pages 5-7)The first sheet defines important terms and helps students understand dot plots (or line plots) and histograms. The second sheet guides students in creating a box and w
Subjects:
Grades:
6th - 9th
Types:
CCSS:
Also included in: 7th Grade Math Activities, Lessons, Projects & More Bundle
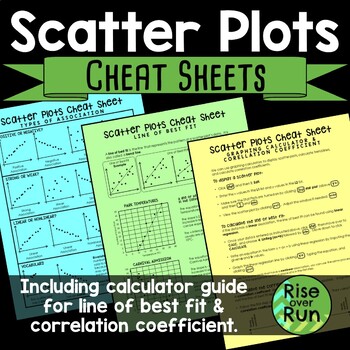
Scatter Plot Cheat Sheets Printable Guided Notes
Detailed sheets for the following topics: •Types of Association & VocabularyThis page shows examples of positive, negative, strong, weak, linear, and nonlinear association. It also shows clusters and outliers.•Line of Best FitThis page explains what a line of best is (or trend line) along with examples and nonexamples. It has 2 real world connections and how to interpret the line of best fit.•Graphing Calculator Guide & Correlation CoefficientThis sheet gives step by step instructions fo
Subjects:
Grades:
8th - 9th
CCSS:
Also included in: 8th Grade Math Activities & Lessons Bundle for the Whole Year
7th Grade Statistics, Probability and Data Guided Notes and Activities
Looking for 7th grade guided notes for Statistics and Probability that are designed to help your students thrive and save you the time and energy of writing and designing them yourself? These NO PREP guided notes are a classroom-proven resource that will have your students proficient in entire 7th Grade Math statistics and probability common core standards. With a comprehensive design, these notes offer a structured approach that can be differentiated for every level of learner for the entire u
Subjects:
Grades:
6th - 8th
Line Plot Notes & Practice | Line Plots Guided Notes | + Interactive Notebook
Searching for an effective way to teach your students how to read line plots? These NO PREP guided notes are a classroom proven resource that will save you time and have your students proficient in line plots in no time! With a comprehensive design, these notes offer a structured approach that can be differentiated for every level of learner. Guided notes are an effective teaching model that maximize your students ability to use working memory to focus on content, rather than copying down notes.
Subjects:
Grades:
5th - 7th
CCSS:
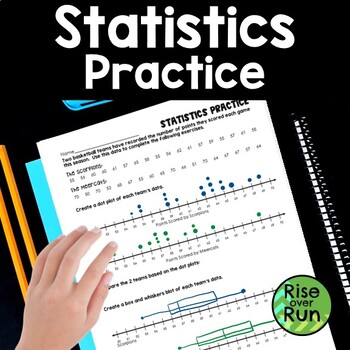
Box and Whiskers and Dot Plot Practice
Practice creating dot plots and box & whiskers plots with this statistics activity.Students are given scores for 2 basketball teams. They use the data to create a dot plot (or line plot) for each team and then a box and whiskers diagram for each team.Then, they compare the data of the teams.A bonus question asks students to calculate the mean absolute deviation.This worksheet can lead to great discussions about how to analyze box and whisker diagrams and make comparisons!
Subjects:
Grades:
6th - 7th
Types:
CCSS:
Also included in: Algebra 1 and 8th Grade Math Curriculum Bundle for Entire Year
5th Grade Fractions Bundle Guided Notes | Operations | Mixed Numbers
Looking for 5th grade guided notes for Numbers and Operations - Fractions that are designed to help your students thrive and save you the time and energy of writing and designing them yourself? These NO PREP guided notes are a classroom-proven resource that will have your students proficient in entire 5th Grade Math Numbers and Operations - Fractions common core standards. With a comprehensive design, these notes offer a structured approach that can be differentiated for every level of learner
Subjects:
Grades:
4th - 6th
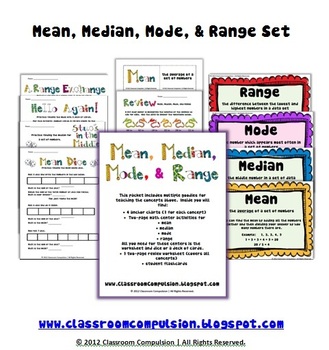
Mean Median Mode Range Pack (Math Centers, Flashcards, Anchor Charts)
This pack has everything you need to supplement your Mean, Median, Mode, and Range instruction! It includes 4 colorful anchor charts (1 for each concept)for you to display around the room, 4 two-page math centers that only require dice or a deck of cards (1 for each concept), a fun set of flashcards for your students, and a two-page review worksheet that covers all the concepts. The preview photos do not show all the pages.
Subjects:
Grades:
3rd - 6th
CCSS:
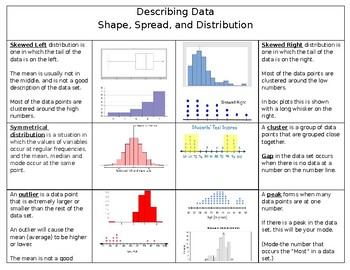
Describing Data based on shape, spread, and distribution
This is a quick foldable already put together for students to use as a reference when describing data based on its shape, spread, and distribution. It goes along with the 6th grade statistics standards.
When printing you should select two sided and print on short edge.
I got the idea from Bailey's corner, but I wanted to make a few changes. Here is the link to her store if you would like to check hers out.
https://www.teacherspayteachers.com/Product/Dot-Plots-and-Describing-the-Shape-of-Data-
Subjects:
Grades:
5th - 9th
Common Core Math 6th Grade - Statistics and Probability - CCSS 6.SP
*This product was revised March 6, 2015. If you purchased the resource before this date, go to My Purchases and download the revised version.*
This resource covers the 6th grade domain, Statistics and Probability. There are lessons and activities on statistical questions, dot plots, histograms, box plots, measures of center, measures of variability and other descriptions of the data set.
1st Activity – Teacher Led Activity
Students identify statistical questions. Data will be collected by the
Subjects:
Grades:
6th
Types:
Showing 1-24 of 1,047 results


