1,472 results
Middle school statistics centers
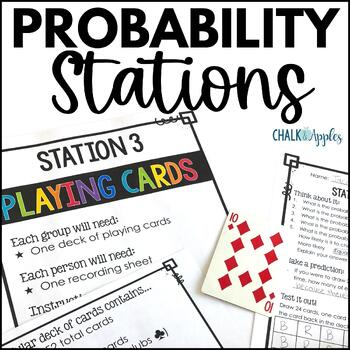
Chance & Probability Activities: Hands-On Theoretical & Experimental Probability
Make teaching probability exciting with these hands-on fun probability activities! This set includes 6 low-prep chance and probability stations perfect for exploring theoretical and experimental probability and critical thinking. Quick and easy setup plus clear student directions make these activities perfect for centers or substitute days, too!Lead your students to discover concepts of probability by exploring it on their own before teaching probability rules. Students will love exploring proba
Subjects:
Grades:
5th - 7th
Types:
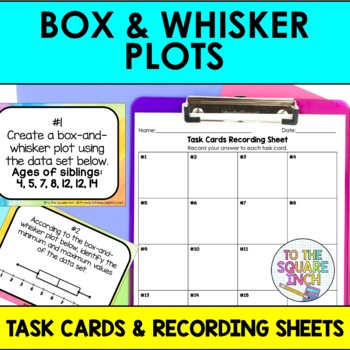
Box and Whisker Plot Task Cards Activity | Box and Whisker Math Center Practice
Boost your students' understanding of box and whisker plots with this engaging task card activity. This low-prep set includes 20 task cards that are perfect for reinforcing all concepts of area of composite shapes. With minimal prep required, your students will practice and build these skills in a fun, engaging and out-of-their seat activity perfect for supplementing any lesson. These cards can quickly be set up for a variety of different activities that will make for a more dynamic learning e
Subjects:
Grades:
5th - 8th
Types:
CCSS:
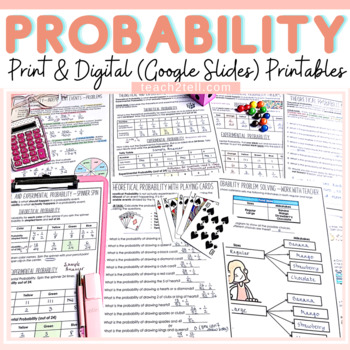
Chance and Probability Activities Print and Digital Worksheets |Google Classroom
Are you teaching your students all about chance and probability and looking for fun hands-on probability activities? This print and digital (google slides) bundle of probability worksheets will reinforce the understanding of theoretical probability, experimental probability, language of chance, sample space, predictions, lists, tree diagrams, dependent probability events and independent probability events.Both US and British English spelling and terminology included.Overview of Activities1. The
Subjects:
Grades:
4th - 8th
Types:
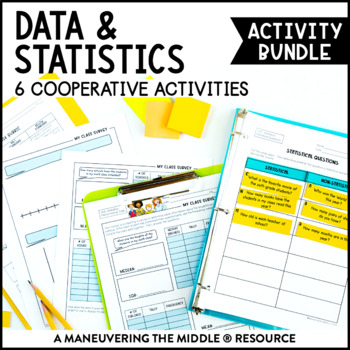
Data & Statistics Activity Bundle | Measures of Center, Histograms, & Box Plots
This Data and Statistics Activity Bundle includes 6 classroom activities to support statistical questions, histograms, box plots, measures of center and measures of variability. These hands-on and engaging activities are all easy to prep! Students are able to practice and apply concepts with these data and statistics activities, while collaborating and having fun! Math can be fun and interactive! Standards: CCSS (6.SP.1, 6.SP.2, 6.SP.3, 6.SP.4, 6.SP.5) and TEKS (6.12A, 6.12B, 6.12C, 6.12D, 6.13
Subjects:
Grades:
5th - 7th
Types:
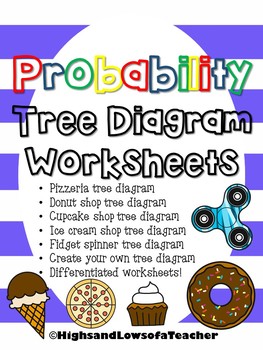
Probability Tree Diagram Worksheets
Use these tree diagram worksheets to help students learn all the outcomes (combinations) for probability unit.What's included-*Pizza toppings probability tree diagram*Donut probability tree diagram*Cupcake probability tree diagram*Ice cream probability tree diagram*Fidget spinner probability tree diagram*Create your own tree diagramAll worksheets come differentiated---one page that has tree diagram drawn in with some combinations already filled-one with tree diagrams drawn in-one blank page only
Subjects:
Grades:
3rd - 8th
Types:
Also included in: Probability Activity BUNDLE
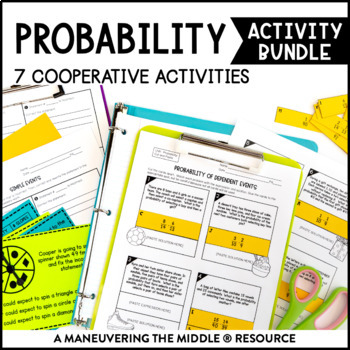
Probability Activity Bundle | Experimental & Theoretical Probability Activities
This Probability Activity Bundle includes 7 classroom activities to determine simple probability, compare experimental and theoretical probability, make predictions, determine independent probability, and find dependent probability. These hands-on and engaging activities are all easy to prep! Students are able to practice and apply concepts with these probability activities, while collaborating and having fun! Math can be fun and interactive!Standards: CCSS (7.SP.5, 7.SP.6, 7.SP.7, 7.SP.8) and
Subjects:
Grades:
7th
Types:
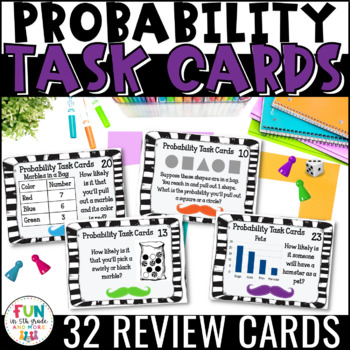
Probability Task Cards Math Review
Probability Task Cards help students practice probability in a fun way. Use these task cards for various activities or math centers to teach/review probability skills such as compound events, likelihood of an event, combinations., and MORE! Use for Scoot, small groups, centers, or whatever else you can think of!This set of 32 cards covers skills such as:**determining the probability of an event**stating whether an event is certain, impossible, least likely, most likely, or equally likely**comp
Subjects:
Grades:
3rd - 6th
Types:
Also included in: Math Task Card Bundle
Deal or No Deal Probability Game for Grades 6 and up
Play a game while learning---what more can a student want? Introduce this take on a popular television game show, Deal or No Deal, to get your students engaged in the study of probability. This pack includes:Directions for contestant/bankerGame sheets for contestant/bankerBrief cases 1-25 (laminate these for durability)Brief cases for $.01-$1,000,000 (laminate these for durability)You may also want to put velcro on the back to make it easier to play and switch cases!Leave feedback and comments
Subjects:
Grades:
6th - 12th
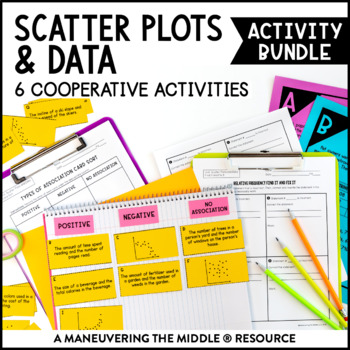
Scatter Plots and Data Activity Bundle | Trend Lines Activities for 8th Grade
This Scatter Plots and Data Activity Bundle includes 6 classroom activities to support 8th grade scatter plots and two-way tables. These hands-on and engaging activities are all easy to prep! Students are able to practice and apply concepts with these scatter plots and two-way table activities, while collaborating and having fun! Math can be fun and interactive!Standards: CCSS (8.SP.1, 8.SP.2, 8.SP.3, 8.SP.4) and TEKS (8.5C, 8.5D, 8.11A)More details on what is included:Six hands-on activities t
Subjects:
Grades:
8th
Types:
6th Grade Math Task Cards | Math Enrichment Task Card Activities Bundle
These 6th grade math task card activities include 87 different challenging task cards to use as review, enrichment, math centers, or with early finishers. The task cards are designed specifically for 6th grade math topics. Concepts include geometry, algebra, numbers and operations, statistics, and other standards listed below. All task cards include a digital Google slides and printable option.Save 40% and get the majority of my math products, including this resource, at a large discount by purc
Subjects:
Grades:
5th - 8th
Types:
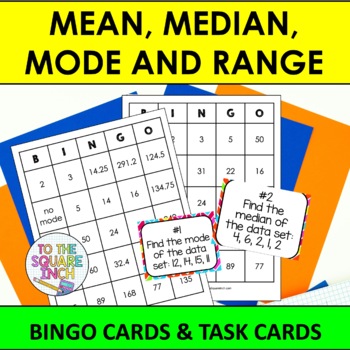
Mean, Median, Mode and Range Bingo Game | Task Cards | Whole Class Activity
Mean, Median, Mode and Range Bingo and Task CardsIncluded in this product:30 unique Range, Mean, Median and Mode bingo cards.25 Range, Mean, Median and Mode calling cards (numbered to be used as task cards for independent or small group work)2 different task cards recording sheetAnswer KeyCheck out my other BINGO games HERE Check out my other data and statistics products HERE
Subjects:
Grades:
5th - 7th
Types:
CCSS:
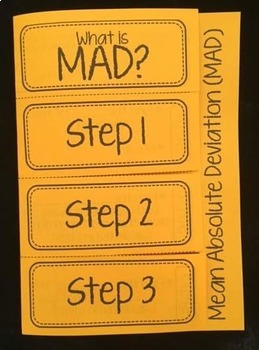
Mean Absolute Deviation MAD Foldable Notes
This editable foldable provides an introduction to Mean Absolute Deviation (MAD). Students will take notes on the meaning of MAD, the steps for finding MAD, and complete 1 example.This works great whole group/ guided instruction, in math centers, as a class work/ homework assignment, or even as an exit slip. Perfect for interactive math notebooks!Now with two options and an editable PowerPoint version!This product is also included in the following bundles:★ 6th Grade Math Foldable + Activity B
Subjects:
Grades:
6th - 7th
Types:
CCSS:
Also included in: Data Analysis and Statistics Foldable Bundle
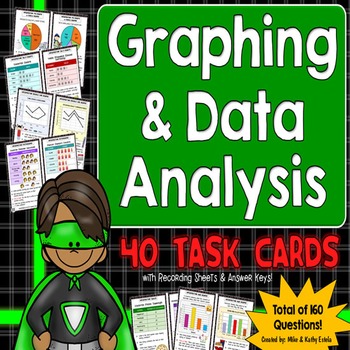
Graphing and Data Analysis Task Cards {Interpreting Graphs and Tables}
Graphing and Data Analysis Task Cards: This set of 40 task cards (with 160 questions total) is designed to help students learn or practice how to read, analyze, and interpret data presented in tables and various forms of graphs. You may use these task cards for individual work, pair/group activity, whole class discussion, or in math centers. NOTE: For a full-page version of these task cards (with exactly the same problems/questions), click this link: Graphing and Data Analysis (Poster Size Task
Subjects:
Grades:
4th - 6th
Types:
Also included in: Math Task Cards SUPER BUNDLE
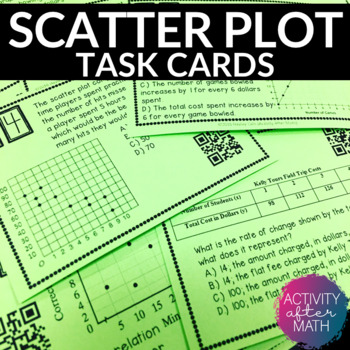
Scatter Plots and Line of Best Fit Task Cards with QR Codes
Get your students involved with practicing Interpreting Data with Scatter Plots and Line of Best Fit! Task cards include multiple choice problems and constructed response. Click here to SAVE and get this as a Task Cards BUNDLEThis resource includes:Teacher InstructionsTeacher TipsStudent Instructions24 Task cards with QR codes24 Task cards without QR codesBlank Answer Document for studentsAnswer Key for easy gradingOptions for using this resource:You can print the ones with QR codes for students
Subjects:
Grades:
8th - 9th
Types:
Also included in: 8th Grade MATH TASK CARDS BUNDLE
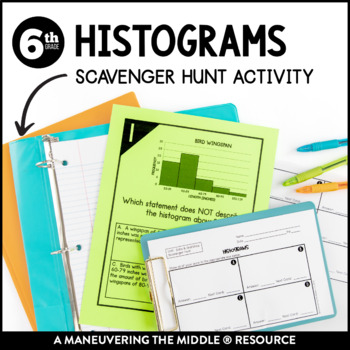
Histograms Scavenger Hunt | Interpreting Histograms Activity
This Histograms Scavenger Hunt consists of 10 clue cards where students must use the clue to interpret histograms. This activity focuses on analyzing histograms and determining which statements are represented in the histogram. This activity is great for in class practice! Students can get out of their seats and move around, while still applying their understanding of data and statistics. Students are able to practice and apply concepts with this histograms activity, while collaborating and havi
Subjects:
Grades:
5th - 7th
Types:
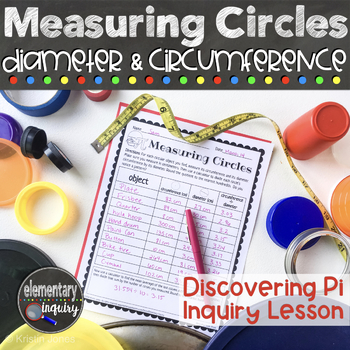
Measuring Circle Circumference & Diameter to Discover Pi - Pi Day Inquiry Lesson
Have fun finding Pi by measuring the circumference and diameter of circles of all sizes! Students will calculate the ratio of the length of a circle’s diameter to its circumference. They’ll discover that the circumference is always a little more than three times as long as the diameter. This full lesson plan and teacher script will help you lead an inquiry based investigation and class discussion. It’s perfect for an introduction to these geometry concepts, or for a fun Pi Day activity.A full, f
Subjects:
Grades:
5th - 7th
Types:
CCSS:
Also included in: Pi Day Activities - Measuring Circles Diameter, Circumference, and Area
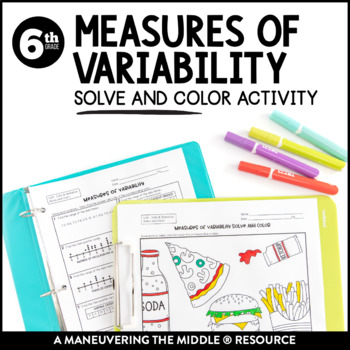
Measures of Variability Coloring Activity | Range & Interquartile Range Activity
This Measures of Variability Solve and Color consists of 8 problems where students will calculate the range or IQR from a data set, dot plot or table. Then, they will locate the answer and color the picture accordingly.This activity is great for in class practice or as a way to spice up independent work! Students can color, while still applying their understanding of measures of variability.Students are able to practice and apply concepts with this measures of variability activity, while collabo
Subjects:
Grades:
5th - 7th
Types:
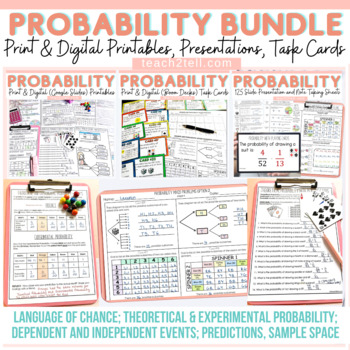
Chance and Probability Activities Theoretical & Experimental Probability Bundle
Are you teaching your students all about chance and probability and looking for fun hands-on probability activities? This print and digital bundle of worksheets, task cards, slideshows and note-taking sheets on Probability will reinforce the understanding of theoretical probability, experimental probability, language of chance, sample space, predictions, lists, tree diagrams, dependent probability events and independent probability events.Both US and British English spelling and terminology file
Subjects:
Grades:
4th - 7th
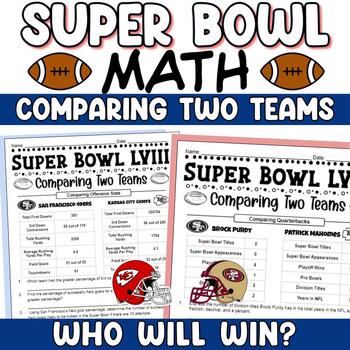
Super Bowl Math 2024 Comparing the Teams - Real NFL Super Bowl Stats
This Super Bowl LVIII Math activity is perfect for football lovers! It uses real-world statistics to compare the Kansas City Chiefs and San Francisco 49ers and asks students to form their opinion of the better team. Skills learned in early middle school are used to compare the quarterbacks, offensive stats, defensive stats and season records of San Francisco and Kansas City. Some of the skills assessed include measures of central tendency, decimals, fractions, percents, ratios, and proportions
Subjects:
Grades:
6th - 8th
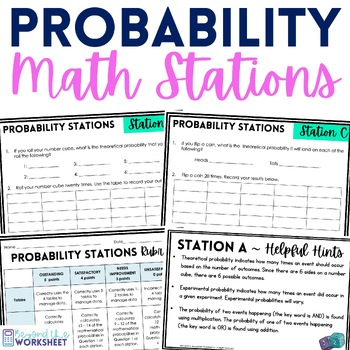
Probability Math Stations | Math Centers
⭐️⭐️ This set of math stations allow students to take a cooperative and hands on approach to learning about probability. Students compare the theoretical probability to their actual experimental results. ⭐️⭐️ A rubric is included, as well as the printables you need for each station (color cards, letter cards and the cuboctrohedron net). Also included are hint cards. You can decide whether or not you give the hint cards to students as they work through the stations. You simply need to provide coi
Subjects:
Grades:
6th - 10th
Types:
Also included in: 7th Grade Math Curriculum Supplemental Activities Bundle
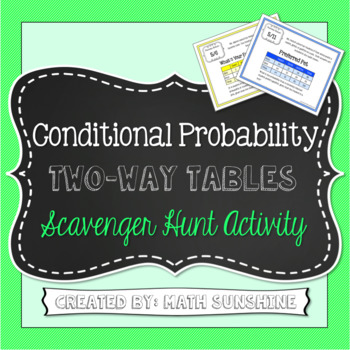
Conditional Probability Two-Way Frequency Tables Scavenger Hunt Activity
Conditional Probability Two-Way Frequency Tables Scavenger Hunt Activity
During this activity, students travel around the room answering conditional probability questions involving two-way frequency tables.
This activity is a great opportunity to group students or let students work with a partner. Students begin by starting at a random station. After a student has found the answer to a station, he will visit the next station using the answer he found. Students continue to move at their own pa
Subjects:
Grades:
6th - 12th
Types:
CCSS:
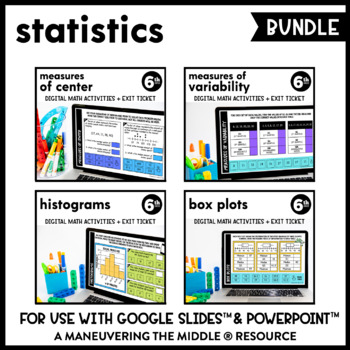
Statistics Digital Math Activity Bundle | Measures of Center | Google Slides
These supplemental digital math activities can be used to support data and statistics concepts. They are interactive (drag and match, using the typing tool, using the shape tool) and paperless through Google Slides™ and PowerPoint™. Topics Included:Measures of Center (4 interactive slides + exit ticket)Measures of Variability (4 interactive slides + exit ticket)Histograms (4 interactive slides + exit ticket)Box Plots (4 interactive slides + exit ticket)What is included?1. Paperless Math Activit
Subjects:
Grades:
6th
Types:
Box and Whisker plots: Understanding, Identifying & Analyzing.
Box and whisker plots pose many problems for students. They often confuse the length of a quartile for the size of data it includes. After seeing my students struggle with this concept for years (even more-so because they had to analyze the data, not merely create the plot) I came up with this activity. The coloring piece, coupled with the dollar bill comparison made something click. I've used the activity ever since! **Please note this activity uses the American Dollar Bill as a portion of a
Subjects:
Grades:
7th - 10th
Types:
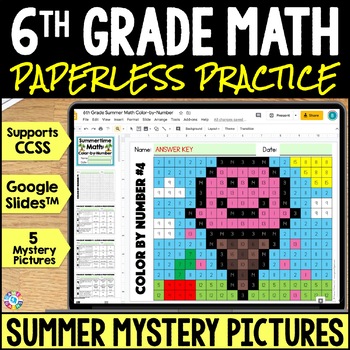
End of the Year Math Fun Activity 6th Grade Review Summer Mystery Picture Slides
Looking for a fun activity for 6th grade math review at the end of the year? With these 6th Grade Math Summer Mystery Pictures for Google Slides™, your students will practice ratios & proportions, number system, expressions & equations, statistics & probability, and geometry standards. Students will love using Google Slides™ to "color" and reveal summer-themed mystery pictures. These digital summer math review activities are fun to use during the final weeks of school or even during
Subjects:
Grades:
6th
Types:
Showing 1-24 of 1,472 results


