40 results
8th grade algebra 2 laboratories
Solving Systems of Equations by Substitution Station Rotation
A Hands-On Approach to Solving Systems of Equations by Substitution. This activity helps students to really understand the substitution method by having them physically replace a variable with its equivalent value.
Subjects:
Grades:
8th - 10th
Types:

Inverse Function Investigation with Desmos.com
In this online investigation, students use Desmos.com as a substitute for the traditional graphing calculator to investigate properties of inverse functions. This is a great introductory activity into inverse functions as it gives students a visual understanding of what a function and its inverse can look like. In the activity, students are instructed to create a table of values for a function, create the table of values for the inverse function, and graph the line y=x. In so doing, students
Subjects:
Grades:
8th - 9th
Types:
CCSS:
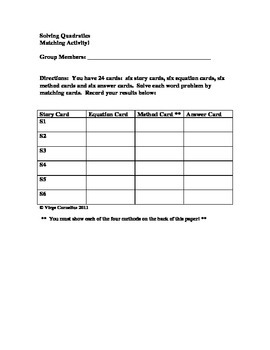
Matching Activity - Solving Quadratics
Three things come to mind as to why I wrote this activity...
First, students are petrified of word problems. I wrote this activity to give students experience with solving applications of the quadratic. Second, I want students to demonstrate their ability to use four different methods to solve quadratics. Third, I want students to be cognizant that they will need to decide which method is best given the structure of the quadratic equation.
There are 24 cards: 4 story cards, 4 equation car
Subjects:
Grades:
8th - 10th
Types:
Quadratic Functions - Introduction to graphing with Technology
I introduce my students to graphing quadratic functions using technology with this self made worksheet. My students like spending time in the computer lab, it gives them independence to try something new and they enjoy seeing the graphs be formed on the screen as soon as they type in an equation and they love getting out of the classroom! It is a lot more fun then graphing with paper and pencil.
I consider this work as a project because it is work done outside a classroom. It requires a com
Subjects:
Grades:
7th - 11th
Types:
CCSS:

Webquest Investigation - Slope of a Line
Using a free online graphing calculator, students explore relationships between linear equations, their graphs, and the slopes of the lines. By the end of this investigation, students will discover relationships between parallel lines, perpendicular lines, and their slopes. Enjoy!
Subjects:
Grades:
7th - 11th, Adult Education
Types:
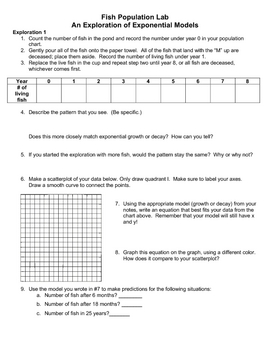
Population Lab: Exponential Growth and Decay
This lab is designed to give students a hands-on introduction to exponential growth and decay functions and their graphs.
Grades:
8th - 10th
Types:
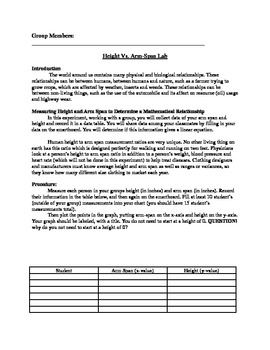
Height Vs. Arm Span Lab: Using real life data and linear regression
Students use their arm-span and heights to create a scatter plot and linear regression to find the equation for a line.
Subjects:
Grades:
8th - 12th
Types:
Systems of Linear Equations - Solving by Graphing with Technology
This is a project I use in my Algebra 2 Honors classroom to help my students practice graphing a system of linear equations.. The questions for each graph are as follows:
Classify the System _______________________
Solution (s) ? if yes, write solution, otherwise, write No Solution_________________________________________
Y-intercept _____________for first line
Y-intercept _____________for second line
This project takes about 1 -2 periods in the computer lab using graphing software or a gra
Subjects:
Grades:
8th - 12th
Types:
CCSS:
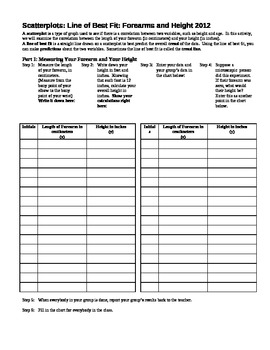
Scatterplots: Linear Regression Line of Best Fit:Forearms and Height (Editable)
After teaching my students about scatterplots, correlation, and the line of best fit, I take a day for them to do a hands-on lab, in which they measure their height (in inches) and their forearm length (from the tip of their elbow, to the bony point on their wrist), and we plot the class data, write the equation of the line of best fit, and then use the equation generated both forwards and backwards. They will need 45 minutes to an hour to do this in class.
Some years, the data have very littl
Subjects:
Grades:
7th - 12th
Types:
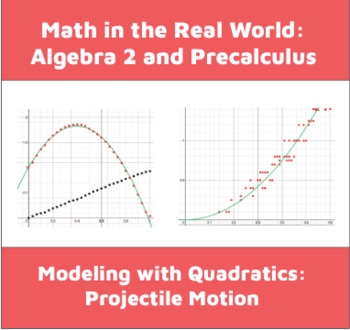
Quadratic Projectile Motion Lab with Data Set
In this activity, students analyze two different data sets that describe how projectiles fly through the air. The first describes the flight path of a thrown ball and the second describes the distance traveled by a ball dropped off a building over time. Using desmos.com, students fit linear and quadratic models to discover which quantities are related linearly (time and horizontal distance traveled) and which are related quadratically (time and vertical distance traveled.) They are asked to inte
Subjects:
Grades:
8th - 12th
CCSS:
Linear Equations Graphing with Technology
This is a project I use in my Algebra classroom to help my students practice graphing linear equations given in standard form using technology such as Geogebra, Desmos calculator or a graphing calculator.
The topics included are finding the following information from the different graphs:
Slope = ___________
X-intercept ________
Y-Intercept _______
Students are also required to write the slope intercept form.
A reflection is required at the end of the project in part to get some fe
Subjects:
Grades:
7th - 12th
Types:
CCSS:
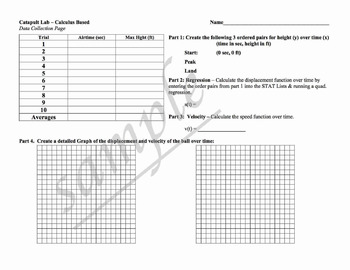
Polynomial Labs (Quadratics, Cubics, etc.) including Catapults!
This lab includes two versions of a catapult lab (calculus based and non-calculus based). Students work in groups to collect data on a ball launched using a catapult. Students create regression equations using a graphing calculator or spreadsheet.
Also included is a painted cubes lab that includes 4 types of functions.
Courses: algebra 1, algebra 2, pre-calculus, calculus
Here are links to my other algebra projects:
Click Here to see my project: Indirect Measurement Labs
Click Here to see
Subjects:
Grades:
8th - 12th, Higher Education, Adult Education
Types:

Which Cell Phone Plan Should I Use?: The Algebra Lab Manual
There are so many advertisers on TV trying to get you to buy their cell phone plans. How do you decide which cell phone plan will be more cost effective? This activity will try to help you decide the answer to this question. As you make your through this activity, it will improve your algebraic skills by reinforcing the theory of graphing data, generating equations, creating data tables, defining variables, and formulating a conclusion for each of your students. The “cell phone plan” activi
Subjects:
Grades:
8th - 11th, Adult Education
Types:

ALGEBRA Bundle: Exponents and Exponential Functions
WELCOME TO KINDLY PASS THE MATH!Teachers will find included in the following BUNDLE over Exponents and Exponential Functions a number of power point lessons over the following sections :* Multiplication Properties of Exponents* Zero and Negative Exponents* Graphs of Exponential Functions* Division Properties of Exponents* Scientific Notation* Exponential Growth Functions* Exponential Decay Functions* Lab Activity over Scientific NotationThe lessons provide students with instruction on ho
Subjects:
Grades:
7th - 12th, Higher Education, Adult Education

Math Lab:Exponential Functions and Seed Overproduction vs Time/DISTANCE LEARNING
My students totally enjoy doing the following math lab! They invariably find it to be both fun to do as well as informative. They readily relate to discussions within.
* Students work with a partner
* Students begin by a brief discussion about seed overproduction
* Students are provided with assumptions used to complete the lab
* Students work collaboratively to determine the number of seeds in a bell pepper
* Students find the average number of seeds in a bell pepper using the totals
Subjects:
Grades:
7th - 11th, Higher Education, Adult Education
Types:
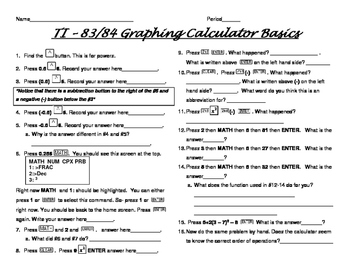
Graphing Calculator Learning Lab
Student will learn some basic commands for the Texan Instruments 83 & 84 calculators
Subjects:
Grades:
7th - 12th
Types:
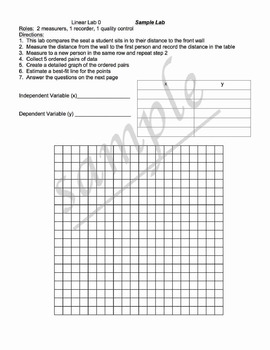
Linear Relationship Labs
This project has 1 sample lab to complete together as a class and 6 other labs that create a linear relationship.
Students work through the labs collecting data and then analyze the data to create equations, use calculators or spreadsheets to create regression equations (best fit lines), and use the equations to make predictions.
classes: algebra 1, geometry, algebra 2, applied math
Here are links to my other algebra projects:
Click Here to see my project: Systems of Equations - Comparing Ph
Subjects:
Grades:
7th - 12th, Higher Education, Adult Education
Types:
CCSS:
M & M's Probability Experiment
In this experiment, the students learn about the basics of probability and what happens depending on the sample size. The students predict based on a sample what is in their bag and then find out if the are correct. Then using the actual data the students calculate probabilities based on individual, group and class results. They graph this information as well.
There are questions along with this activity that ask why and get at their thinking. In the end they compare the class results wit
Subjects:
Grades:
3rd - 12th
Types:
Algebra 1 Absolute Value Equations - Graphing with Technology
This is a project I use in my Algebra 2 Honors classroom to help my students practice graphing absolute value equations and understand Parent Functions, Domain and Range in addition to locating the Vertex, x-intercept and y-intercept. .
The questions for each graph are as follows:
How is this graph different from y= |x| ?______________
What is the Vertex ? ______________________________
Domain or x-values? ______________________________
Range or y-values?__ ________________ _____________
If an
Grades:
8th - 12th
Types:
CCSS:
The Survival of the Florida Manatee
Are you interested in the survival of the Florida Manatee? In this activity the student will investigate the effect of power boat registrations and the effect on the mortality of the Florida Manatee. Topics covered in this activity are graphing data, determining if a relationship exists between the variable, calculating a linear equation of best fit, making projections. A spreadsheet software or graphing calculator is suggested for this activity.
There are 7 pages with 6 questions and an option
Grades:
8th - 11th, Adult Education
Types:
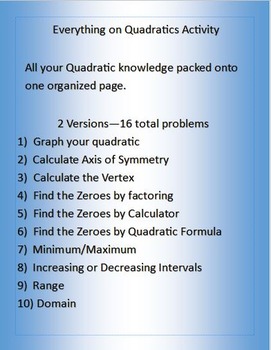
Everything on Quadratics
Use this activity to help your students discover and practice Quadratics. It covers graphing, quadratic formula, factoring, zeroes, roots, solutions, x-intercepts, axis of symmetry, min/max, increasing/decreasing intervals, and the vertex. Everything is on one page, so students learn that there are multiple ways to find the zeroes of a quadratic. Their knowledge allows them to pick the best method. This pack includes 2 versions, 16 total problems, all problems worked out in the included key.
Subjects:
Grades:
8th - 12th
Types:

I'm Stalking You - Linear Functions and Statistics Lab
Students will grow corn stalks while collecting data. This data will be used to write a linear function, using appropriate domain and range, in point-slope form, slope-intercept form and function notation. Statistics come in to play when students find the linear regression equation that models their data and use that information to discuss interpolation vs. extrapolation as well as residuals. The lab is set up in steps, making it possible to focus only on functions or use of the entire lab.
Subjects:
Grades:
8th - 12th
Types:
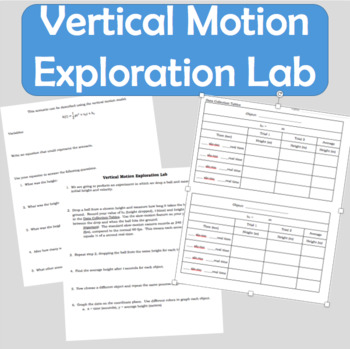
Vertical Motion Exploration Math Lab - Discovering through Inquiry
Do you have those students that always ask about how this relates to real life? This math lab is the solution. Students will work through an experiment just like they would in science class to discover through self-inquiry that vertical motion is best represented with parabolas and quadratic functions. The experiment allows students to discover this phenomena through inquiry and data collection. After collecting data, students will have their "a-ha" moment. Students will quickly be able to
Subjects:
Grades:
7th - 12th, Higher Education, Adult Education
Types:
MaLab Complementary and Supplementary Angles from Light Rays/DISTANCE LEARNING
Students have a great time with this lab learning about complementary and supplementary angles as seen through the following activity using light rays!
* Students begin the activity by defining Complementary and Supplementary angles
* Students observe light traveling in straight, parallel lines through the teeth of a comb
* Students learn about angles of incidence and angles of reflection using light, the comb and a mirror.
* Students calculate the complements and supplements to the ang
Subjects:
Grades:
8th - 12th, Higher Education, Adult Education
Types:
Showing 1-24 of 40 results


