48 results
6th grade graphing outlines
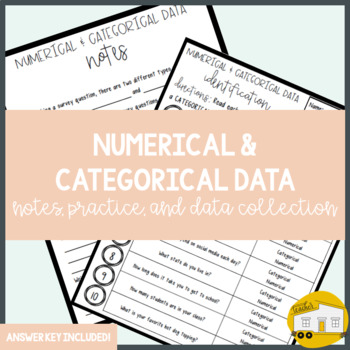
Numerical & Categorical Data - Notes, Practice, and Application!
Help students understand the difference between Numerical and Categorical Data as you discuss their explicit meanings through notes. Reinforce the concepts and make it real-life for students as they create their own survey questions and survey their classmates! ✨ print-and-go...no prep required!✨ answer keys included!✨ engaging activities!This resource can be used to:✔️ introduce the concept for the first time, or✔️ review this topic in a fun way!_______________________________________Reviews fr
Subjects:
Grades:
3rd - 6th
Types:
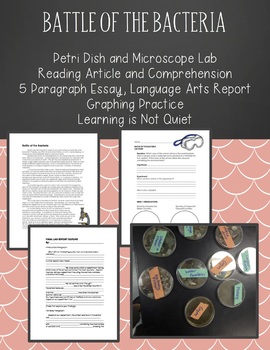
Battle of the Bacteria Cells Petri Dishes (Article, experiment, report)
Battle of the Bacteria Video / Lesson Plan Explained: https://www.youtube.com/watch?v=OAXqaKTLoRcWhether you teach upper elementary or middle school, it can be difficult to fit all of the subjects in a given day. With this activity, it makes it simple to teach math, writing, reading, health, and of course science together with one experiment. (I have done this activity as a 5th grade and 7th grade teacher).In this activity, students go throughout the school and collect samples of places that t
Subjects:
Grades:
5th - 7th
Types:
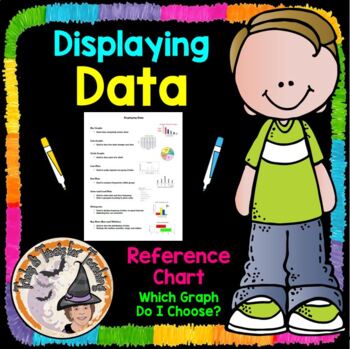
Displaying Data Reference Chart Notes Which Graph Do I Choose?
Math Teachers ~ You'll LOVE this Displaying-Data, Which-Graph-Do-I-Choose? Data-Display Reference-Chart will be SUPER helpful to your students in helping them determine which graph to choose, and provides a quick visual picture to remind them what that particular graph looks like. I printed one of these for each of my students to put inside their Math Toolkit Notebook, to use as a Reference for Data Displays Charts and Graphs. You'll enjoy using this year after year!Be sure to L@@K at my other 1
Subjects:
Grades:
5th - 8th
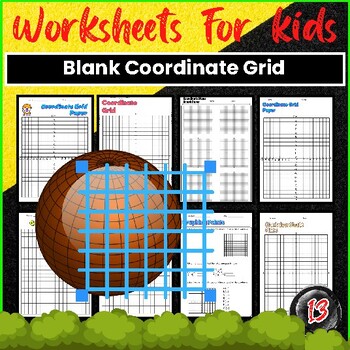
Blank Coordinate Grid Worksheets
Coordinate grids are essential tools for practicing math skills and understanding spatial relationships. Whether you're a teacher looking for extra resources or a student wanting additional practice, blank coordinate grid worksheets are a great way to strengthen your understanding of plotting points and graphing equations. This worksheet provides a coordinate grid graph that makes it easy for students to plot points. So, students don't need to create their own graphs because they need to print t
Subjects:
Grades:
3rd - 6th
Types:
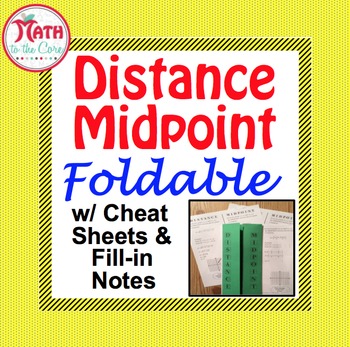
Distance and Midpoint Foldable - Cheat Sheet
Distance and Midpoint Foldable - Cheat Sheet
Create a distance and midpoint foldable or just pass out the cheat sheet, the choice is yours. Great when you need to differentiate for your students.
Page 1 Cheat Sheet Fill-in with formula
Page 2 Cheat Sheet Fill-in without formula
Page 3 Cheat Sheet Key
Page 4 Front of Foldable
Page 5 Inside of Foldable Fill-in with formula
Page 6 Inside of Foldable Fill-in without formula
Page 7 Inside of Foldable Key
Products you may also like...
View
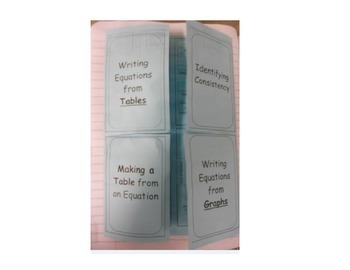
Constant Speed Foldable (Relating tables, graphs, and equations)
This is a great foldable for any interactive math journal and focuses on the different aspects of constant speed in the 6th grade common core. Because this is a tricky concept for kids to remember, this entire foldable is dedicated to this one skill. Students will take notes, write equations, look at tables and graphs, and make tables.. This foldable will ensure that students are efficient professionals in no time and have excellent understanding of the relationship between tables, equations, an
Subjects:
Grades:
6th - 8th
CCSS:
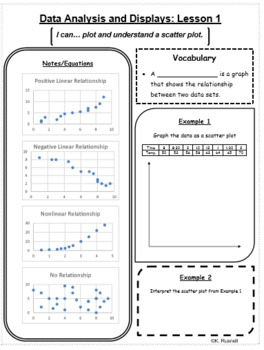
Data Analysis and Displays Notes
These guided notes are created to help differentiate and guide instruction for the math curriculum. This set of notes has been written based off of 8th grade standards and follows the Big Ideas Curriculum, but can be used for similar grades. Each page of notes includes an "I can" statement, vocabulary, student notes, step-by-step guides, examples, and story problems. Each notes is reduced to one page for quick reference. The vocabulary cards that go along with the vocabulary within the notes can
Subjects:
Grades:
6th - 10th
Types:
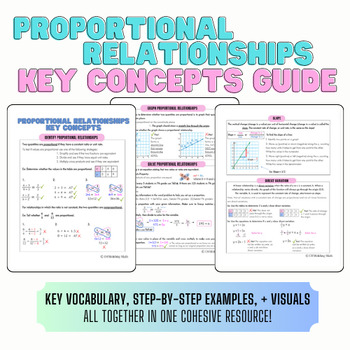
Proportional Relationships Key Concepts Guide/Anchor Charts
This key concepts guide gives students all of the information they need to successfully learn about proportional relationships. Students are given information on proportional relationships and counter examples. They are also given information about graphing proportional relationships, solving proportions, slope, and direct variation.Teaching proportional relationships to your classes soon? This is your much needed resource to support your students and save you from constantly repeating yourself!
Subjects:
Grades:
6th - 8th
Types:
Also included in: 7th Grade Key Concepts Guides/Anchor Charts: BUNDLE
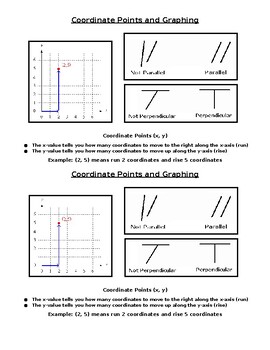
Coordinate Points and Graphing
Editable! Scaffolded notes that show how to read coordinate points and what the x and y points and axis show you.
Subjects:
Grades:
4th - 6th
Types:
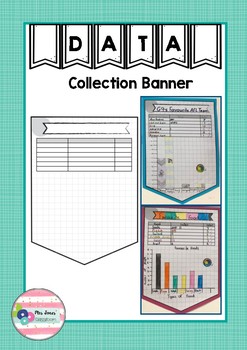
Data Collection Banner
Are your students collecting their own data and representing it using a graph this term? Then why not get them presented on this banner pendant and display them in your room.
Subjects:
Grades:
1st - 10th
Types:
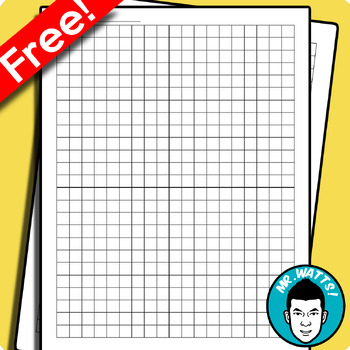
Graph Paper (Free!)
Ready to do some graphing? Here are two easy to use sheets to use in class for graphing. - 1cm boxes with no major axis- 1cm boxes with major axis labeledEnjoy!____________________________________________________________________________________GRAMMAR PARTY!Complete Grammar Bundle (Save Over 50%) Includes everything below!Nouns Worksheet + TestPrepositions Packet + TestAdjectives Worksheet + TestVerbs/Adverbs Worksheet + TestFact or Opinion Worksheet + TestNouns, Verbs,Adjectives Worksheet + Tes
Subjects:
Grades:
3rd - 9th
Types:
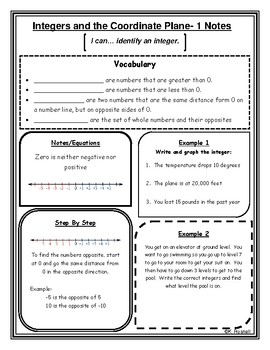
Integers and the Coordinate Plane Notes
These guided notes are created to help differentiate and guide instruction for the math curriculum. This set of notes has been written based off of 6th grade standards, but can be used for similar grades. Each page of notes includes an "I can" statement, vocabulary, student notes, step-by-step guides, examples, and story problems. Each notes is reduced to one page for quick reference. The vocabulary cards that go along with the vocabulary within the notes can be found on my page as, "Math Vocabu
Grades:
4th - 9th
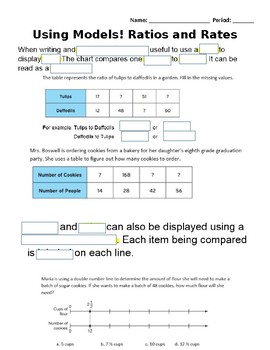
Using Models to Represent Ratios, Rates and Unit Rates Scaffold Notes
Students will use these fill in the blank notes to guide them through the Smartboard lesson on Models for ratios, rates and unit rates (located in store). Each page of the lesson is a screen shot with missing words. Students will fill in the blank and answer practice problems on handout. There is a lot an answer doc with the missing words filled in for any students with accommodations.
Subjects:
Grades:
5th - 7th
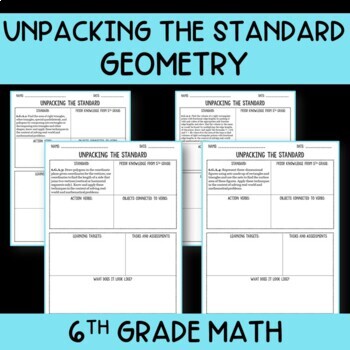
Unpacking the Standard - Geometry
Have you ever looked at a standard and wondered, “What is this? How am I going to teach it?” Have you ever had a student say, "What do all of these words mean in this standard? I don't know what its saying."? If so, this resource is for you!The work of learning and implementing new standards has to happen quickly. Implementing standards effectively requires teachers and students to dive deep into the standards to fully understand expectations and goals. Instead of saving the unpacking just for
Grades:
6th
Types:
Also included in: 6th Grade Math Common Core GROWING Bundle
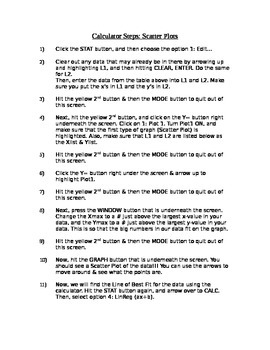
Line of Best Fit TI-83 Calculator Steps (step-by-step directions handout)
This is a document that can be used as a handout for students to help walk them through the steps on the calculator of finding a line of best fit for data. These are steps that are made for a TI-83 or TI-84 PLUS graphing calculators. It walks them through how to enter the data into a table, graph the data as a scatter plot, and find the Linear Regression line for the data. These steps are very detailed and it has helped my students tremendously!!!
Subjects:
Grades:
5th - 12th
Types:
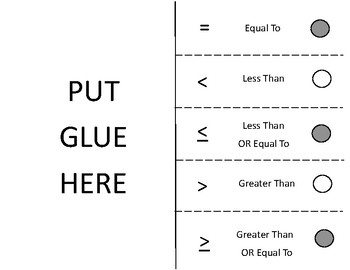
Solving and Graphing Solutions
This foldable takes students from the basics of graphing solutions to solving one step equations and inequalities and graphing the solutions.
This item includes all inequalities.
This item gives examples in which all variables are on the left side (for easy graphing).
This item does not contain inequalities that require multiplication or division of negative numbers (in which you would need to switch the sign).
Subjects:
Grades:
6th - 7th
Types:
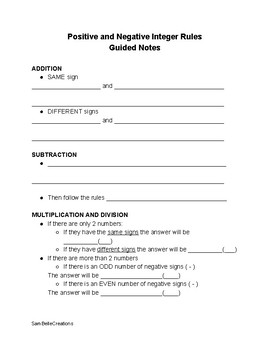
Positive and Negative Integer Rules Guided Notes
Positive and Negative Integer Rules Guided Notes and Key
Subjects:
Grades:
6th - 8th
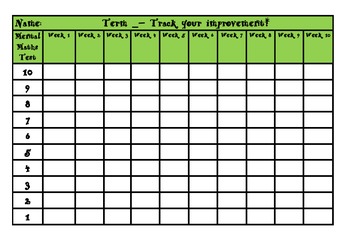
Track your improvement - mental maths graph!
Here is a printable that you can give to your students, which will help them to graph their weekly mental maths test results! Each set contains the most commonly sized mental maths tests - a graph for 10, 15, 20 and 30 questions. I have found that students achieve the best results when they can see themselves improving, and have to physically colour in a graph each week. They love trying to beat their score! This is great to put into their portfolio or take home folder so that parents (and stude
Subjects:
Grades:
2nd - 7th
Types:
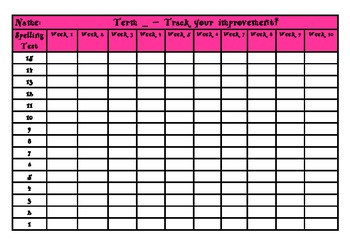
Track your improvement - spelling graph!
Here is a printable that you can give to your students, which will help them to graph their weekly spelling test results! Each set contains the most commonly sized spelling lists - a graph for 10, 15 and 20 words. I have found that students achieve the best results when they can see themselves improving, and have to physically colour in a graph each week. They love trying to beat their score! This is great to put into their portfolio or take home folder so that parents (and students) can see the
Grades:
2nd - 7th
Types:
Conducting a Survey Booklet
This is a booklet that students can use to organize the process of conducting a survey. They start with coming up with a research question and possible outcomes. Then they move to a tally chart where they can survey and record data. Then there is a graph section to graph their data. The last section is the analysis of data where students can show what they have learned from their data and survey.
Grades:
3rd - 6th
Types:
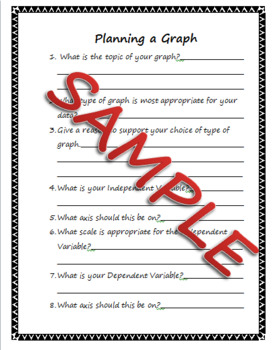
Planning a Graph Worksheet
I used this 2-page worksheet with my high school students to plan how to create their graphs. It goes through all parts of the graph, and reminds students of what to include. Students my plan out their graph and then easily create it on paper or on the computer.You will receive a 2-page PDF. If you have any questions - I'd prefer you ask me BEFORE purchasing rather than leaving less than flattering feedback after purchasing. :)
Subjects:
Grades:
6th - 12th
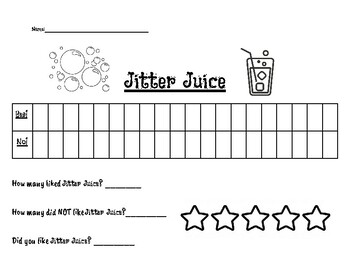
Jitter Juice Experiment
Here is a fun and interactive science experiment and math activity, based on the children's book "First Day Jitters"!
Subjects:
Grades:
PreK - 6th
Types:
NGSS:
K-2-ETS1-1
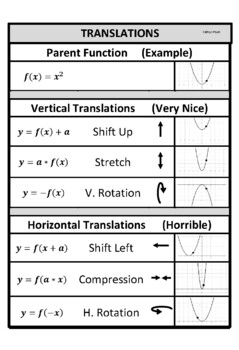
Translations (PDF)
Translations. Vertical and Horizontal. Shift, Stretch, Compression, and Rotation.
Subjects:
Grades:
6th - 12th, Adult Education
Types:

Bubble Gum LAB
Students will walk through the scientific process, learn about mass and use a triple beam balance while doing a bubble gum activity.
Subjects:
Grades:
2nd - 8th
Types:
Showing 1-24 of 48 results


