312 results
Free graphing graphic organizers
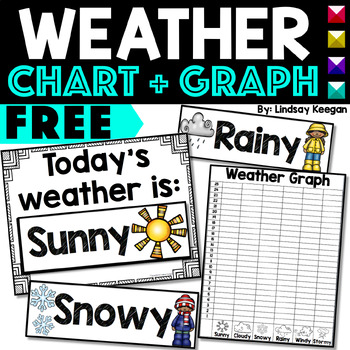
Weather Chart and Graph FREEBIE!
This weather chart and graph will make a great addition to your calendar or morning message board! Check out the matching Days of the Week Labels - Calendar Cards set!Included in this resource:- A sign that says "Today's weather is" - 8 weather cards - Sunny, Rainy, Cloudy, Partly Cloudy, Snowy, Foggy, Windy and Stormy- A weather graph for tracking I hope you and your students enjoy this FREEBIE!Thank you for stopping by!Grab this fun weather bundle here: Digital and Print Weather Activities****
Subjects:
Grades:
PreK - 2nd
Types:
Also included in: Weather Activities and Weather Worksheets plus Digital Activities Bundle
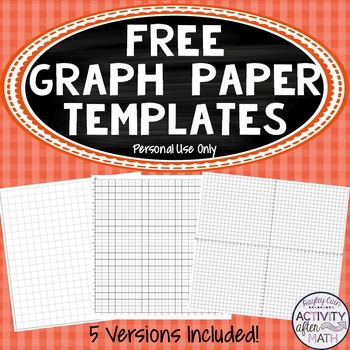
FREE Cartesian Coordinate Plane Graph Paper Templates (Personal use only)
This is a set of 5 different Cartesian Coordinate Plane Graph Paper templates. This is great for helping teach graphing ordered pairs, teaching Algebra concepts, drawing pictures, graphing equations, creating line graphs from word problems, etc.Included in this product:5 separate Coordinate Planes:-1st Quadrant to 20 -1st Quadrant to 20 with Fractional Gridlines-1st Quadrant to 20 No labels-All 4 Quadrants to 20 -All 4 Quadrants to 20 No LabelsPlease note that this product is for PERSONAL use ON
Subjects:
Grades:
5th - 9th

Transformations Rule Cheat Sheet (Reflection, Rotation, Translation, & Dilation)
Included is a freebie on transformations rules (reflections, rotations, translations, and dilations). You can have students place the cheat sheet in their interactive notebooks, or you can laminate the cheat sheet and use it year after year!
Grades:
8th - 10th
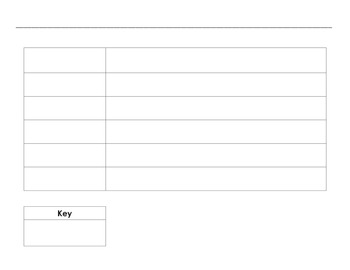
Pictograph Template, Data and Graphing Picture Graph Template, Word File (.docx)
Enhance your elementary data and graphing unit with an editable pictograph template. I've created this picture graph template as a table within a Microsoft Word document (.docx) so that you can easily adapt it to suit your needs. PDF and jpg versions are also included.
Common Core Math Standards:
3.MD.B.3 - Draw a scaled picture graph and a scaled bar graph to represent a data set with several categories.
2.MD.D.10 - Draw a picture graph and a bar graph (with single-unit scale) to represent a
Subjects:
Grades:
PreK - 5th
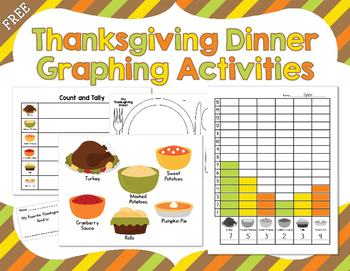
Thanksgiving Day FREEBIE! Thanksgiving Dinner Graphing Activities
Happy Thanksgiving! Hope you can use this with your class!
This includes a fun whole group graphing activity for students to graph their favorite Thanksgiving foods. It includes directions for using this activity, a page with 6 Thanksgiving foods to choose from, student response slips, a "Count and Tally" sheet, student graphing sheets, and a fun follow-up activity for students to draw their favorite Thanksgiving dinner.
***********************************************************************
Subjects:
Grades:
K - 3rd
Slope Graphic Organizer and Guided Notes
This is a great graphic organizer to help students recall four different ways to find the slope of a linear function. These four ways include: From a graph, an equation, a table, and two given points.
The second graphic organizer helps students have a reference guide for positive, negative, zero, and undefined slope.
This graphic organizer has guided notes, multiple examples, and little tricks to help students remember positive, negative, zero, and undefined slope.
The Link-Slope Task Car
Grades:
6th - 12th, Higher Education, Adult Education
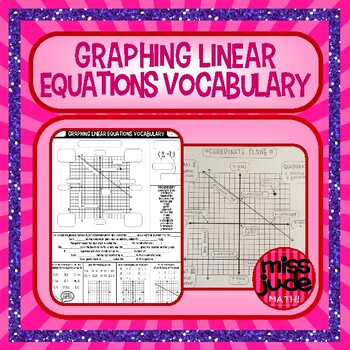
Graphing Linear Equations Vocabulary guided notes
Fill-in notes to introduce students to the basic vocabulary associated with plotting points and graphing on the coordinate plane.
Grades:
Not Grade Specific
Community Helpers Bubble Map and Graphing FREEBIE
I love teaching about Community Helpers in my classroom! In this FREE download you will receive bubble map anchor chart pieces and a graphing activity that can be included as a part of a Community Helpers unit in your classroom.
If you enjoy this product, please remember to leave feedback. :)
You may also enjoy my Community Helpers Math and Literacy Centers Plus More! unit, which includes 150 pages of Community Helper fun!
http://www.teacherspayteachers.com/Product/Community-Helpers-Ma
Subjects:
Grades:
PreK - 3rd
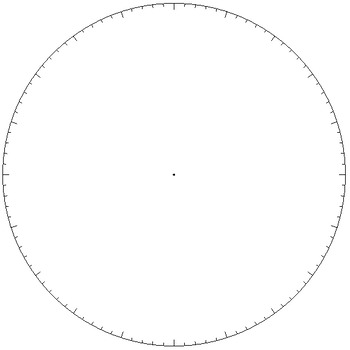
Pie Chart / Circle Graph - Simple Template
Pie graphs can be tricky to make by hand when the sections aren't easy fractions of the pie. This simple template gives a circle marked off with 100 'tick lines' for easy graphing of percentages of the whole pie. A second template using dots is included too. A dot in the centre of the circle is included too, making it easy to use a ruler and draw lines out to the edge.
It's a .docx (Word) file containing two images. Feel free to copy, paste, modify, distribute, embed...
~CalfordMath
If
Subjects:
Grades:
Not Grade Specific
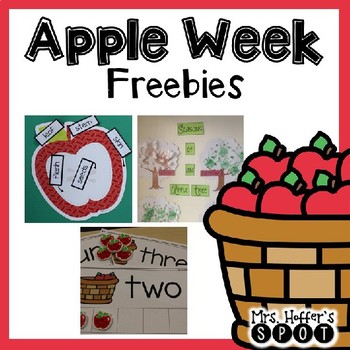
Apple Week Activities FREE
This is the perfect activity to do during apple week. There are pieces to make an anchor chart and a response sheet for the students to do while you do it whole group. Also included is a picture of how the chart looks when completed.
Also included are 5 Frame mini eraser activities and labels for the parts of an apple.
Grades:
PreK - 3rd

Groundhog Day Graphing and Writing Prompt Freebie
Will the groundhog see his shadow? Are you ready for spring or would you like six more weeks of winter? These are questions that your students will ask themselves and their classmates with this groundhog day freebie. Included are 2 graphing activities as well as 3 writing prompts.
If you have any questions, please ask!
Grades:
K - 3rd
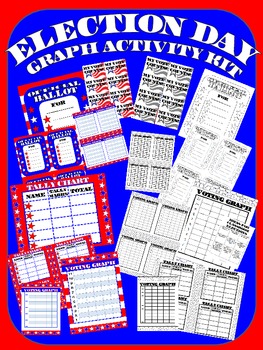
FREEBIE! Election Day Classroom Kit! Common Core Fun + Instruction
Are you looking to integrate this year's elections into your classroom? If so, this is the kit for you. In this 18 page document you will find Full Color and Black and white copies of each of the following...
1. Full Page Voting Ballot
2. Four to a Page Voting Ballots
3. Full Page Voting Graph With Numbers
4. Full Page Voting Graph Without Numbers (Scale)
5. Four to a Page Voting Graphs with Numbers
6. Four to a page Voting Graphs Without Numbers
7. Full Page Voting Tally Chart
8. Four To a Pag
Grades:
2nd - 5th
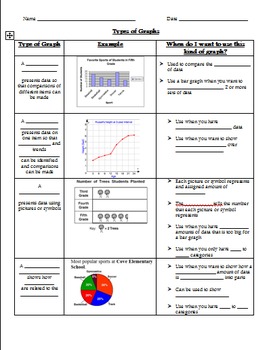
Types of Graphs Graphic Organizer
Multiple graphic organizers included. Students explore various types of graphs and learn about the characteristics and advantageous traits of each type, including line plot, histogram, line graph, circle graph, bar graph, stem-and-leaf plot, and double line graph. There are two types of graphic organizers included. The first is a basic graphic organizer that can also be used as an assessment in which students just identify the type of graph. In the second graphic organizer, students fill in key
Grades:
3rd - 7th
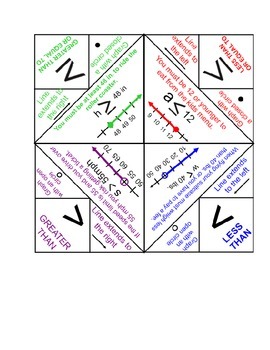
Inequality Notes: Fortune Teller (Cootie Catcher)
"Math Teacher's Got Problems" Inequality Notes
This product is a fun and engaging way for students to take notes. The cootie catcher is ready to print and fold! Notes include the 4 types of inequalities, how to graph on the number line and a real world example! This is the perfect way to introduce inequalities, great for interactive notebooks and is guaranteed to peak students interest. Please see my store for other activities designed to increase engagement and designed to make math NOT your
Subjects:
Grades:
6th - 8th
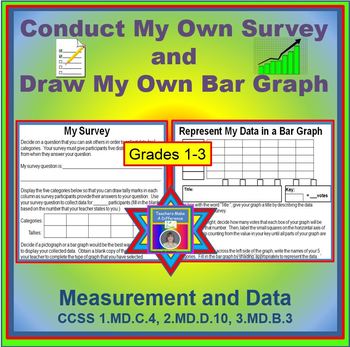
Conduct My Own Survey & Build My Own Bar Graph FREEBIE
FREE!!! FREE!!! FREE!!! FREE!!! FREE!!! FREE!!! FREE!!!
I created what I hope to be a fun but helpful resource for your students in Grades 1-3. In return, I ask that you please take time to rate and leave feedback to let others know how the activity worked for you and your students. I appreciate your time and effort!
In Grades 1-3, students are expected to be able to build their own bar graph with 3-5 categories. This resource will guide the students through the process of developing a survey
Grades:
1st - 3rd
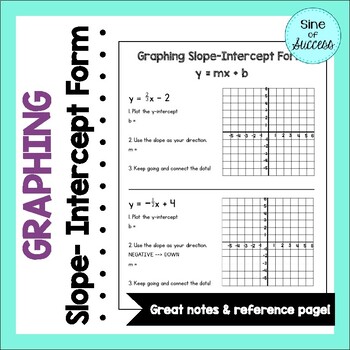
Graphing Slope Intercept Form Notes
Slope Intercept Form NotesScaffolded notes that can be used as part of interactive notebooks or simply as a worksheet! It is a one page file with two graphing problems that should be used as a resource for students.This resource guides students through the process of graphic y = mx + b without creating a table of inputs and outputs. It breaks down the problem by having students identify the intercept and graph it, then identify the slope and use rise over run to graph.This is not intended to be
Grades:
8th
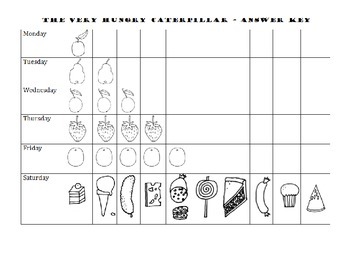
Graphing - The Very Hungry Caterpillar
Students will create a graph after listening to The Very Hungry Caterpillar. Students will cut and paste the food items eaten on each day.
Guiding questions: Ask students which day has the fewest pieces of food. Ask which days have more food than Wednesday.
Grades:
PreK - K
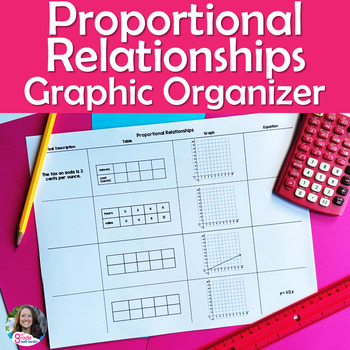
FREE Proportional Relationships Notes Graphic Organizer
This organizer helps students see proportional relationships represented by a verbal description, table, graph, and equation. Students will fill in the blanks to show proportional relationships represented various ways. You can then have them highlight the constant of proportionality from each representation. I hope this is helpful to you and your students!Please follow me! ~ 8th Grade Math TeacherYou may also like...Proportional vs. Not Proportional Graphic OrganizerProportional Relationships P
Grades:
7th
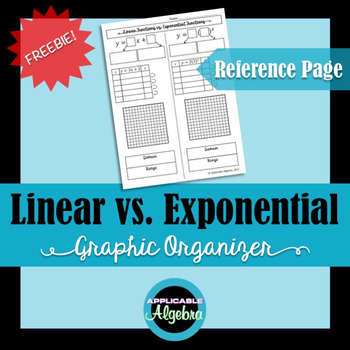
Linear vs. Exponential Functions - Graphic Organizer - Freebie!
A simple, thorough graphic organizer for students to fill out and use as a reference page. Compare equations, tables, graphs, and the domain/range of a linear and exponential function side by side.
After students have mastered linear functions and I’ve introduced exponential functions, I use this as a review so that students can see the differences side by side. They keep these notes and use them as a reference throughout the unit.
Subjects:
Grades:
8th - 12th
CCSS:
Math Notebooks: K-1 Data & Graphs
These data & graphing printables for Kindergarten and First Grade were created to support the use of math journals/notebooks in your classroom. Aligned with the Common Core, the resources in this packet are designed to engage students, aid differentiation, save paper and monitor student achievement.What others are saying:"Wow! This is so incredibly indepth and I love how differentiated the graphing activities are. Thanks so much for sharing these freebies!" -Liz M."This is great! I like
Grades:
K - 1st

What I See, What It Means: Teaching Analyzing and Interpreting Data (NGSS)
Examining data can be overwhelming for adults, let alone students. Use this strategy to break down the data available to you into smaller parts that you can more easily access and interpret. This guide walks you through the process and provides you with a simple analysis worksheet that can be used with ANY piece of visual data.Terms Of Use:Copyright © Nicole VanTassel. All pages of this product are copyrighted, and all rights are reserved by the author. You may not create anything to sell or sh
Grades:
6th - 12th
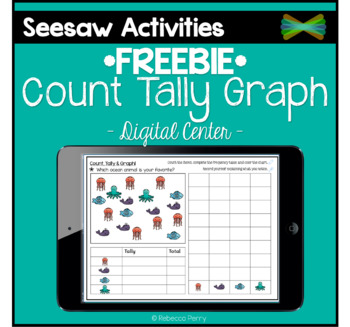
Seesaw Activities Templates - *FREEBIE* - Count, Tally, Graph - Online Learning
*FREEBIE OF THE WEEK*February 18th 2018Do you use Seesaw in your classroom? These Count, Tally, Graph pages are ready to assign in Seesaw and are an excellent way to introduce the app to your students! Build home-school relationships by letting parents see the learning taking place in your classroom! There are two data groups to choose from, each with four levels - building from a tally and bar chart, to asking questions about the data! Use as an assessment, a Math center or as part of your teac
Subjects:
Grades:
1st - 3rd
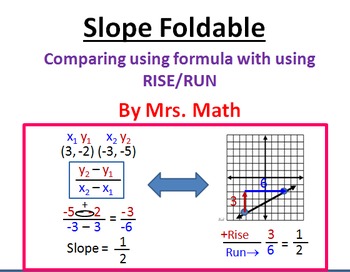
Slope Formula and Rise/Run Foldable
Power Point includes animated step-by-step instructions for creating a foldable for comparing graphing using slope formula and using RISE/RUN to determine the slope from a graphs. Materials needed for each student: scissors, ruler, 2 to 3 markers, 2 printable graphs (provide in power point), glue, and a piece of card-stock or construction paper.
Mathematical foldables (or graphic organizers) are a great way to put important information at students fingertips. They can be used to introduce con
Grades:
7th - 10th
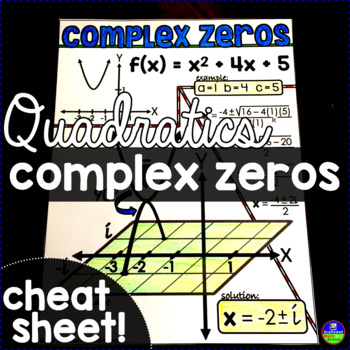
Complex Numbers Cheat Sheet
This reference sheet for complex solutions in quadratics is helpful for showing students what these nonreal solutions look like when graphed. An example is given of a quadratic that is solved with the Quadratic Formula to find 2 complex solutions. The complex zeros are shown on the complex plane by flipping the parabola upside down and turning it 90 degrees. Students can color the reference sheet to personalize it for their notebook or binders. The sheet can also be enlarged into a poster as an
Subjects:
Grades:
10th - 12th
CCSS:
Also included in: Algebra 2 Activities Bundle with Digital Updates
Showing 1-24 of 312 results


