1,860 results
8th grade graphing assessments
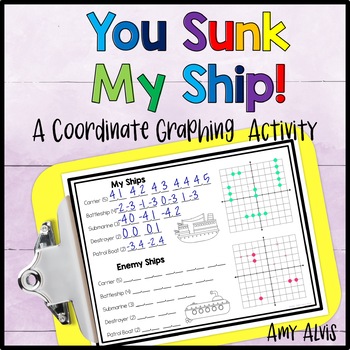
Coordinate Plane Graphing Plotting Points Math Battleship Activity
You Sunk My Ship is a coordinate plane graphing activity, similar to Battleship, where students will battle it out in a head to head competition trying to locate each other's ships. Your students can complete in this engaging and strategic activity while practicing their math skills. Includes file folder game boards for quadrant I practice as well as one that uses all 4 quadrants (4 versions for each one). Also included are one page versions of the activity as well as a quiz.Packet includes:-Te
Subjects:
Grades:
5th - 8th
Types:
Also included in: 6th Grade Coordinate Graphing Bundle Poster INB Game NO PREP Printable
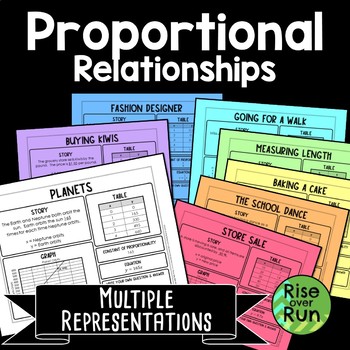
Proportional Relationships Graphing with Multiple Representations
These multiple representation math tasks help students make connections between graphs, tables, equations, and real world scenarios. Students are given a little information and must think how to fill in the rest!8 activity sheets each include: a story a grapha tableconstant of proportionalityan equation a space for students to write their own question and answer. A blank template is included as well so students can create their own proportional relationship.Multiple representations are a great w
Grades:
7th - 8th
Types:
Also included in: 8th Grade Math Activities & Lessons Bundle for the Whole Year
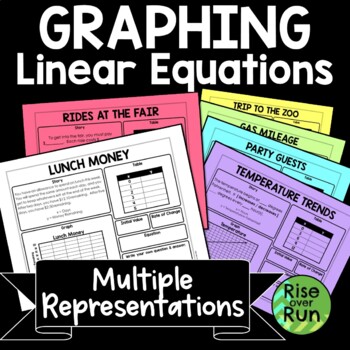
Linear Equations Graphing Worksheets with Multiple Representations
These activity sheets will help students make connections between linear graphs, equations, tables of values, and the stories they represent. This resource is one of my favorites and best sellers! Included are 6 different sheets, each with a different scenario and a different representation given. For example, students may be given an equation, and they must fill in a graph to match, missing parts of the story, a table, and identify the initial value and rate of change. The sheets range in d
Grades:
8th - 9th
Types:
CCSS:
Also included in: 8th Grade Math Activities & Lessons Bundle for the Whole Year
Writing, Solving, and Graphing Inequalities - 6.EE.B.5 and 7.EE.B.4.b
This contains 4 different activities that will teach your students all about writing, solving, and graphing inequalities and includes real world problems. There is two sets of interactive guided notes that can be done together and have plenty of practice examples. There is two sets of practice worksheets that students can complete in class or for homework. I have included both 1 and 2 step inequalities. Students will need to already be familiar with solving equations to solve the inequalities
Subjects:
Grades:
6th - 9th
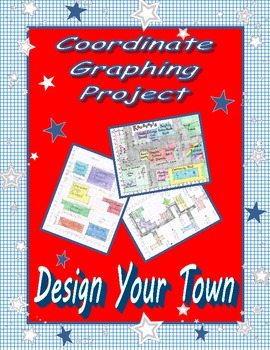
Coordinate Graph (Ordered Pairs) Project & Rubric "Design Your Town"
Coordinate Graph (Ordered Pairs) Project and RubricDesign Your TownThis fun project allows students to demonstrate their knowledge of coordinate graphing and ordered pairs by designing their own town. Instructions include requirements for minimum number of buildings, areas, and points in the town, which they must label. Students must also list coordinates for each item on a separate sheet of paper so it may be recreated, and they must write questions about the town they designed. I've include
Grades:
3rd - 8th
Types:
Calculating Speed, Time, Distance, and Graphing Motion - Distance Time Graphs
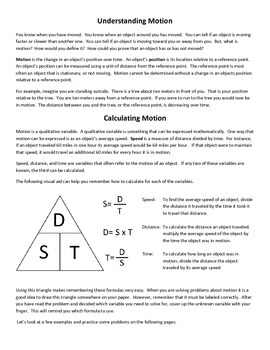
This activity is centered around the concept of motion. This activity defines motion and gives instruction and examples on how it cat be calculated and graphed. This activity includes informational text on calculating and graphing motion as well as a variety of problems to check for understanding. There are problems that involve solving for speed, distance traveled, and time in motion. Distance vs. Time and Speed vs. Time graphs are discussed. Twelve distance vs. time graphs and twelve spe
Subjects:
Grades:
4th - 9th
Graphing Practice 30 Quick Graph Sheets for Bar, Line, & Pie Graphs
Graphing Practice for Middle School! These are great to use as bellringers, exit tickets, or just extra practice, and work well for either a science class or math class.Using a data table, students supply the title, label the X- and Y-axes, practice finding appropriate number intervals, and make the graph. My average sixth grade students take 5 - 10 minutes per graph. The half-sheet format saves paper. Now available as ready-to-use EASEL activities!Each data table includes factual informatio
Grades:
5th - 8th
Types:
Systems of Linear Inequalities - Guided Notes and Homework
This 9-page lesson contains 5 pages of guided notes and 4 pages of HW. Part 1 covers slope-intercept form, while part 2 covers standard form. It is part of my Systems of Equations Unit * Click the preview for details! Answer key included! * In this lesson students will: - Explore what it means for an ordered pair to be a solution to a system of inequalities - Learn why graphing is the only way to represent the solution set to a system of inequalities - Explore different cases involving parall
Grades:
7th - 10th
CCSS:

Beaker Pong: Experimental Design and Graphing Lab, NGSS aligned
Great 1st week or 1st month STEM activity! All parts are EDITABLE and includes a graphing grid! This is a great way to introduce the "science process" (better phrase for scientific method) at the start of a semester or anytime you want fun to occur in your classroom.*****Focus on the NGSS PRACTICES Dimension*****The National Research Council's (NRC) Framework describes a vision of what it means to be proficient in science; it rests on a view of science as both a body of knowledge and an evidenc
Subjects:
Grades:
7th - 12th
Types:
Systems of Equations and Inequalities Unit - Guided Notes and Homework
This unit contains the 8 lessons below:1) Intro to Systems of Equations2) Solving Systems of Equations by Graphing3) Solving Systems of Equations by Substitution4) Solving Systems of Equations by Elimination5) Systems of Equations: Choosing the Best Method6) Systems of Equations Word Problems7) Systems of Inequalities8) Systems of Equations Graphic OrganizerCheck out their previews for more details!
Grades:
7th - 10th
CCSS:
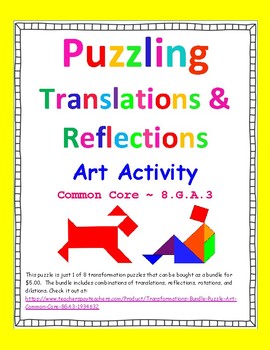
Translations and Reflections Puzzle - Transformation Art Activity - CCSS 8.G.A.3
This is a high interest, interactive activity that will allow you to easily see if your students have mastered translations and reflections on a coordinate plane. Students must use the given pre-image points, perform the stated transformations, and then plot the new image points to create a figure which they can then color and decorate. This can be used as an in class activity, home project or an assessment. Also great for math centers to review.This activity can be purchased as part of a $5.00
Grades:
7th - 11th
Types:
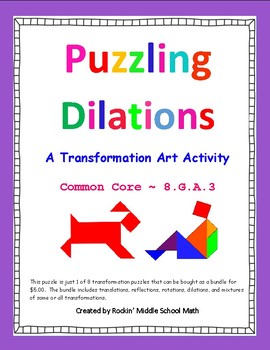
Dilations puzzle - Transformation Art activity - CCSS 8.G.A.3
This is a high interest, interactive activity that will allow you to easily see if your students have mastered dilations on a coordinate plane. Students must use the given pre-image points, perform the stated dilations, and then plot the new image points to create a figure which they can then color and decorate. This can be used as an in class or home project or an assessment. Common Core 8.G.A.3 - Describe the effect of dilations, translations, rotations, and reflections on two-dimensional figu
Grades:
7th - 10th
Types:
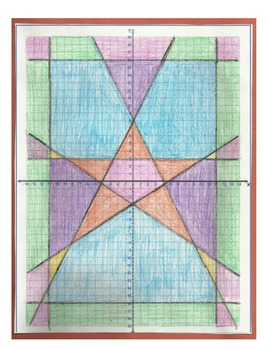
Graphing Linear Equations Quilt Project
Graphing Linear Equations Quilt ProjectI have created this project as a fun way to get my kids excited about graphing lines. I have always found that including art and coloring with math gets kids a bit more excited about learning and as an added bonus- they look great as classroom decorations when finished! These quilts focus on accuracy when graphing diagonal lines along with vertical and horizontal lines.This is a 100 point project that includes: directions for the students, a sheet for the s
Grades:
8th - 11th, Adult Education
Types:
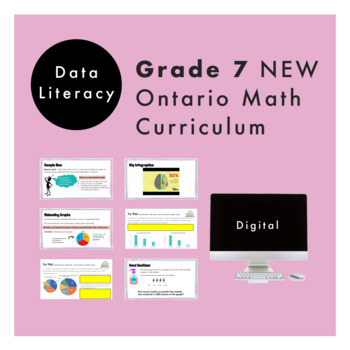
Grade 7 Ontario Math - Data Literacy Curriculum - Digital Google Slides+Form
This resource is for the Grade 7 DATA strand and covers ALL specific expectations for “D1. Data Literacy”. Do you need a practical and engaging resource for the NEW Ontario Math Curriculum? This NO-PREP, editable Google Slide resource is what you need! In this resource, students will experience math through engaging real-life questions, storytelling through math, and interactive slides. For teachers who are given Nelson© Math by your board, this resource loosely follows the order of the Data Ma
Subjects:
Grades:
6th - 8th
Types:
Also included in: Grade 7 NEW Ontario Math Curriculum Full Year Digital Slides Bundle
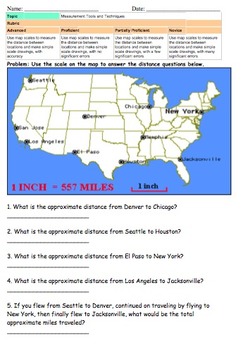
Map Scale (Measuring and Drawing)
There documents require students to use their understanding of map scales to measure distances on a map and to add destinations on a map.
There are 3 documents that use map scale understanding to measure distances across the United States.
2 documents require students to construct their own map using their knowledge of map scales.
Generally I will teach the core knowledge of the benchmark then use one page as classwork, one page as homework, and one page for an assessment.
Subjects:
Grades:
3rd - 8th
Types:
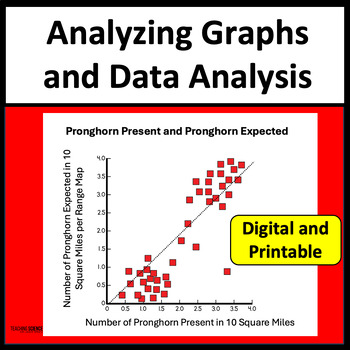
Analyzing Graphs and Data Analysis Middle School Science Test Prep and Practice
Do your students need practice with analyzing graphs? These science graph worksheets include data analysis with different types of graphs. They are great for science test prep and critical thinking. This set includes 25 pages of science graphs with questions. You will get a printable PDF with a link to Google Slides.This Ecosystem Graph Practice Unit Includes:25 printable pages of charts and diagrams with questions(Google Slides and Printable PDF)Answer KeysTwo simplified graphing pages for diff
Subjects:
Grades:
6th - 8th
Types:
Multiple Intelligences Survey, Graph, and Explanation Cards
We should not ask, "How smart are you?" but rather, "How are you smart?" This multiple intelligences activity will:
*Be a great back to school activity that allows you to get to know your students and their learning styles!
*Allow students to identify their own "smarts" (learning styles): math smart, word smart, people smart, self smart, music smart, nature smart, art smart, and body smart.
*Teach students more about what it means to be a specific "smart."
*Reinforce basic graphing and labelin
Grades:
1st - 8th
Types:
Analyzing Plots, Graphs, and Tables using Measures of Central Tendency
This product provides students the opportunity to analyze data presented in different ways. By making calculations and analyzing data, students make conjectures and justify them using mathematical reasoning and evidence!What is included?This product contains 8 student work pages. Each work page contains a set of data displayed graphically with accompanying questions. The data displays included are 2 dot plots, 2 bar graphs, 2 frequency tables, and 2 stem-and-leaf plots. Students are required
Subjects:
Grades:
5th - 11th
Types:
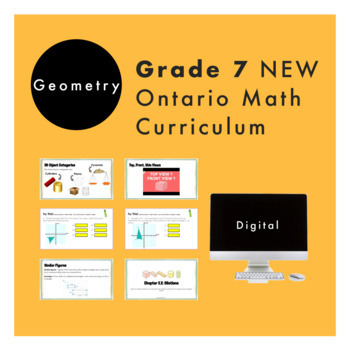
Grade 7 Ontario Math - Geometry Curriculum - Digital Google Slides+Form
Do you need a practical and engaging resource for the NEW Ontario Math Curriculum? This fully editable Google Slide resource is what you need! This resource is for the Grade 7 SPATIAL SENSE strand and covers ALL specific expectations for “E1. Geometric and Spatial Reasoning”. In this resource, students will experience math through engaging real-life questions, storytelling through math, and interactive slides. For teachers who are given Nelson© Math by your board, this resource loosely follows
Grades:
6th - 8th
Types:
Also included in: Grade 7 NEW Ontario Math Curriculum Full Year Digital Slides Bundle
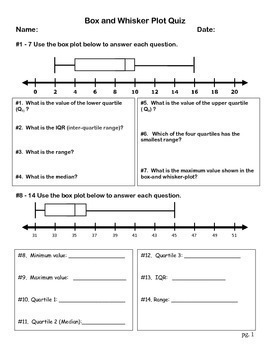
Box and Whisker Plot Quiz (Paper Format & Google Form)
PDF Copy & Google Form This 25 question quiz assess student's understanding of box and whisker plots. Questions are asked about median, IQR, range, lower extreme, upper extreme, and more. Students are also tasked with finding the median of several data sets as well as determining the five number summary of a data set. Check out the preview!
Subjects:
Grades:
6th - 8th
Types:
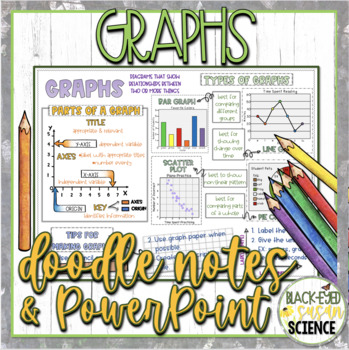
Graphs Doodle Notes & Quiz + Power Point
-DIFFERENTIATED CONCEPT NOTES -QUIZ -ANSWER KEYS -RIGOROUSDo your students love to doodle while taking notes? Don't fight it, embrace it with Doodle Notes (aka Squiggle Sheets)!!!These notes are not only fun but help students to meet Next Generation Science Standards.Notes are differentiated. 3 versions are included. Use the included answer key or choose to use the blank version to make the notes your own.Some things covered in these notes:parts of graphstipstypes of graphsbarlinecirclescatter
Grades:
6th - 8th
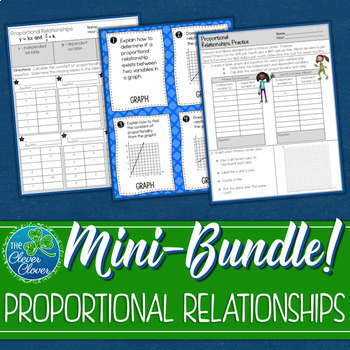
Proportional Relationships in Tables, Graphs and Equations Mini-Bundle
If you are looking for a solid resource to supplement your proportional relationships instruction, this is it! This resource includes task cards, worksheets, and assessments on proportional relationships in tables, graphs and equations. Below you will find a detailed description of each resource. Proportional Relationship Task CardsThis product includes twenty task cards divided into five stations about proportional reasoning. The stations include four questions on each of the following: graph
Grades:
6th - 8th
Types:
CCSS:
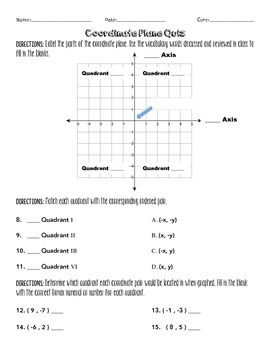
Coordinate Plane Quiz
The Wright Ladies present a coordinate plane quiz. Great review for students to check understanding of the basics of the coordinate lane and graphing points.
Included in this download is a PDF version of the formative assessment and answer key.
Grades:
4th - 10th
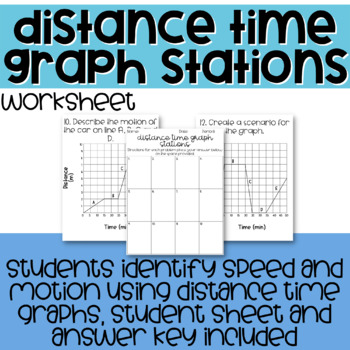
Distance Time Graphs Stations
In this station activity students will be identifying and describing the motion of objects by using a distance / time graph. Students will also use distance / time graphs to determine the speed of an object. This download includes 12 distance / time graph problems for students to complete. This activity is aligned with science TEKS 6.8 C, and TEKS 6.8 D.
Subjects:
Grades:
5th - 12th
Types:
Also included in: Force and Motion Growing Bundle
Showing 1-24 of 1,860 results


