21 results
5th grade statistics activboard activities
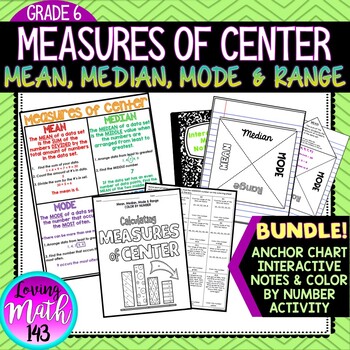
Mean Median Mode and Range Interactive Notes, Poster and Activity BUNDLE
Mean, Median, Mode & Range Color By Number ActivityThis color by number activity is a fun and engaging way for students to practice calculating the measures of center including mean, median, mode and range. Students will solve 16 questions involving mean, median mode, and range then find their answer on the color by number sheet. If their answer is not on the color by number then their answer is not correct. This activity is aligned with the sixth (6th) grade common core standards.WHATS INCL
Subjects:
Grades:
5th - 8th
Categorical Data vs Numerical Data Flip Chart
In this flip chart, students will learn the difference between categorical data and numerical data, examples, and key vocabulary. The activinspire flip chart allows the teacher to reveal the information by removing the shapes over the correct information. At the end of the lesson are five questions which the students have to classify as categorical or numerical.
Grades:
5th - 8th
Types:
Which Graph Do I Use to Display Data? Flip Chart
This review of various graphs indicates which graph is best to use for certain types of data. At the end, there is a 10 question multiple choice activote activity where the students are given a situation and have to choose the correct graph to display their data.
Subjects:
Grades:
4th - 8th
Types:
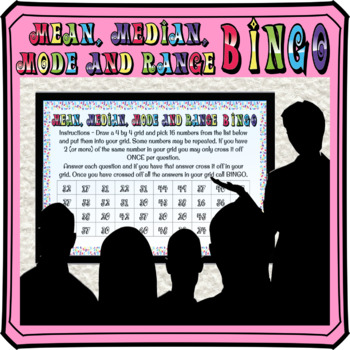
Mean, Median, Mode and Range math BINGO
This mean, median, mode and range activity is a really fun way for students to practice. Skills include finding the mean, median, mode or range from a list of numbers. All give positive integer answers.Show the questions on a Smart Board or projector. Your students will love it and won't realize how many questions they are answering!This product includes:★ A PowerPoint display with instructions, student choice bingo numbers and 40 questions★All 40 numbers on screen for students to make their own
Subjects:
Grades:
5th - 8th
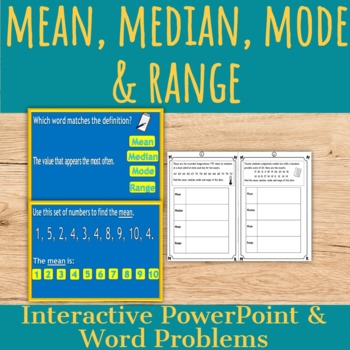
Mean, Median, Mode & Range: Word Problems and PowerPoint
This is a powerpoint activity which includes definitions and examples of mean, median, mode and range followed by an interactive multiple choice quiz.Also included is a worksheet pack of twelve word problems which could be used as a follow up activity. Each problem asks for the calculation of the mean, median, mode and range.
Subjects:
Grades:
5th - 7th
CCSS:
Also included in: 6th Grade Math Bundle
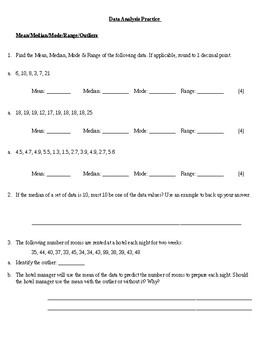
Data Analysis Practice (Mean, Median, Mode, Outliers, Graphing)
Worksheet practicing skills such as:
- Calculating Mean, Median, Mode, Range, Outliers
- Choosing the best graph/measure of central tendency
- Drawing & Analyzing Circe Grapgs
Subjects:
Grades:
5th - 9th
Types of Graphs and Their Uses Flip Chart
This lesson discusses the definition of various types of graphs and their uses. Included topics: bar graphs, double bar graphs, line graphs, circle graphs, pictographs, and more.
Subjects:
Grades:
4th - 8th
Types:
Data Fun Powerpoint
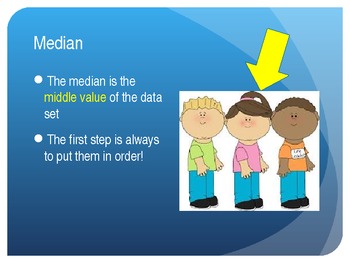
This powerpoint includes a TON of different pieces of information about data! The first section introduces mean, median, mode and range with examples then gives the students an opportunity to practice. The second section covers the many different ways to display data, and the third section has several different graphs that the students will need to analyze.
Subjects:
Grades:
4th - 5th
Statistical Questions Interactive Presentation - 6.SP.1
Interactive Powerpoint will provide students with definitions, opportunities to differentiate between statistical questions and non-statistical questions and the ability to write statistical questions. The lesson moves step by step through the material in a way that will keep students interested and provide a basis for future learning. Use with smartboard, projector, computer, pad or as printables. Great lesson for cooperative learning or centers.
Objectives:
- Recognize statistical questions
Subjects:
Grades:
5th - 8th
CCSS:
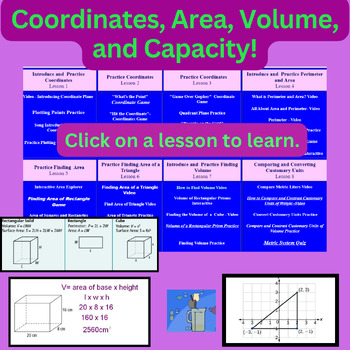
EXPLORING COORDINATES, AREA, VOLUME, CAPACITY! Supports Virtual Learning!
Access practical strategies for learning Coordinate, Area, Volume, and Capacity concepts tailored to diverse learning styles with just one click. Approaches include interactive games, videos, and PowerPoints.This product is a website designed to align with the Coordinate, Area, Volume, and Capacity concepts taught in Unit 9 of Everyday Math curricula for 5th grade. However, it can quickly adapt to other publishers and grade levels that cover similar skills.This resource provides activities for a
Subjects:
Grades:
4th - 6th
Reading & Creating Circle Graphs Flip Chart
This lesson involves reading and creating circle graphs. It includes key vocabulary, steps to reading a circle graph, and how circle graphs are created. It also includes examples of open response questions for reading and interpreting circle graphs.
Subjects:
Grades:
4th - 8th
Types:
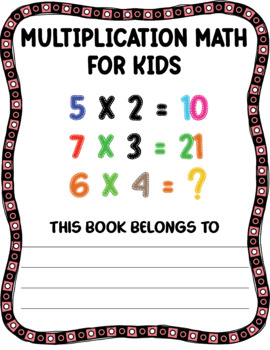
Practice thinking skills and enjoy multiplication math for kids.
For practice thinking skills and enjoy multiplication math for kidsSuitable for your childrenFor parents, you can easily download and print them at home. For children to practice skills.learning full of worksheets, activitiesfun exercise in math skills for kindergarten children.
Subjects:
Grades:
5th - 6th
Reading and Creating Line Graphs Flip Chart
This lesson is on creating and reading line graphs and double line graphs using ActivInspire. Use this instructional lesson plan before assigning the line graph project located in my teacher store.
Subjects:
Grades:
4th - 8th
Types:
Ratios Smart Notebook
This is a smart notebook presentation introducing and discussing ratios.
Subjects:
Grades:
4th - 6th
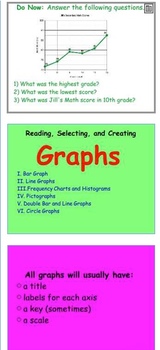
Glencoe Course 1 Ch 12 Flipchart (Grade 6): Statistical Displays
This flipchart can only be opened using ActivInspire!
This is an editable flipchart to follow along with the textbook chapter.
Complete chapter flip chart including do nows, notes, sample problems, homework, homework answers, and activities!
Subjects:
Grades:
5th - 6th
Types:
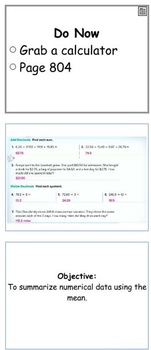
Glencoe Course 1 Ch 11 Flipchart (Grade 6): Statistical Measures
This flipchart can only be opened using ActivInspire!
This is an editable flipchart to follow along with the textbook chapter.
Complete chapter flip chart including do nows, notes, sample problems, homework, homework answers, and activities!
Subjects:
Grades:
5th - 6th
Types:
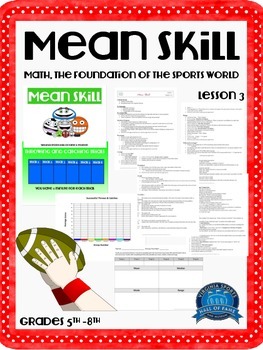
Mean Skill Lesson 3
Mean Skill – for 5th-8th grade. This is the third and final lesson in the lesson series. Each lesson builds upon the last, and this final installment focuses on mean, median, mode, range, graphing and analyzing. Students test their own skills in a series of trials and use that data just like athletes would to make predictions based on averages then compare players using graphs. This final lesson wraps up the message and mission of showing your students how math learned in class is used in the
Subjects:
Grades:
5th - 8th
Line Graphs: Temperature and Rainfall Statistics Activity
An easy to read math lesson activity for your students to think creatively about data sets and create visual representations of real life data! Students will consider what different types of graphs that could work for these data sets, then create a graph that creates comparisons between temperature and rainfall. A great activity to solidify student understanding of graphs and data sets.
Subjects:
Grades:
3rd - 7th
Probability & Statistics ActiveInspire Flipchart Word Problems w/Voters Activity
This file includes 16 probability and statistics word problems. The problems are created as a flip chart within the application Active Inspire. They are set up to use with Active Inspire voters, but can also be used without voters if you prefer. If you do not have the Active Inspire and do not wish to download it, I can send you the file as a PDF so you can use the questions as stations, or by posting them for students to work out on individual whiteboards, or any other way you think of.
The ty
Subjects:
Grades:
5th - 8th
Christmas stickers book(100 sticker )christmas activities
Christmas sticker book is the perfect craft for kids to get together and spend time together, teaching them about the true meaning of Christmas. This is a fun activity that is great for Christmas parties, family gatherings, and more. Kids will love this activity.
Grades:
PreK - 5th
Chapter 13: Statistics & Probability - Activinspire Flipcharts
Pre-Algebra Chapter 13 notes on a flipchart file to be used with a Promethean, Smartboard or other Interactive boards. This is a completely EDITABLE collection of the lessons that I teach throughout the school year. Lessons compatible with McGraw-Hill Glencoe Pre-Algebra textbook and Common Core Standards.You can earn FREE TPT money by leaving reviews on any paid resources! You will see the balance show up the next time you check out!Also, be sure to check out my teaching videos at this link: ht
Subjects:
Grades:
5th - 12th
Also included in: Pre-Algebra lesson notes for the "ENTIRE YEAR" - Activinspire Flipcharts
Showing 1-21 of 21 results


