445 results
5th grade statistics resources $5-10
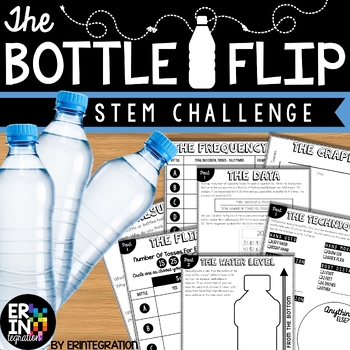
Water Bottle Flip STEM Challenge + STEM Activity
The ORIGINAL water bottle flip STEM activity and lab! Water bottle flip at school? Absolutely! Students will love this on-trend STEM challenge inspired by the popular YouTube water bottle flipping challenge where students toss a water bottle and attempt to land it straight up. Practice scientific method with some probability, fractions and data collection in the mix while having fun!This self-paced, low-prep, project based learning water bottle flip STEM challenge is print-and-go. Each activit
Subjects:
Grades:
3rd - 6th
Types:
CCSS:
NGSS:
K-2-ETS1-2
, K-2-ETS1-3
, MS-ETS1-2
, K-2-ETS1-1
, 3-5-ETS1-3
...
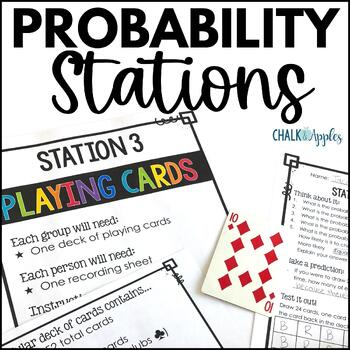
Chance & Probability Activities: Hands-On Theoretical & Experimental Probability
Make teaching probability exciting with these hands-on fun probability activities! This set includes 6 low-prep chance and probability stations perfect for exploring theoretical and experimental probability and critical thinking. Quick and easy setup plus clear student directions make these activities perfect for centers or substitute days, too!Lead your students to discover concepts of probability by exploring it on their own before teaching probability rules. Students will love exploring proba
Subjects:
Grades:
5th - 7th
Types:
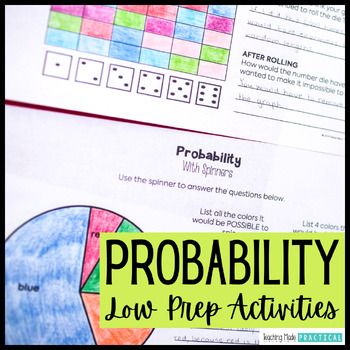
Probability Activities - Fun Review Worksheets, Spinners, Dice, Task Cards
These low prep probability activities and worksheets make a great introduction or review. Students will practice probability vocabulary - certain, impossible, possible, likely, unlikely, and equally likely - and apply these words in a variety of situations and events. Students will also get the opportunity to think about different probability events with hands on practice using spinners, coins, and dice. The fun probability activities include: 6 anchor charts / probability posters to help stu
Subjects:
Grades:
2nd - 5th
Types:
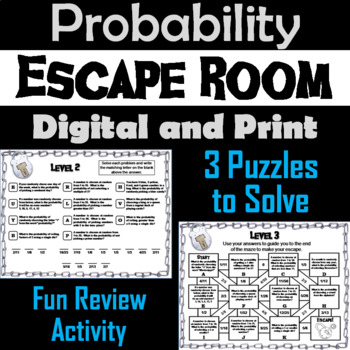
Simple Probability Activity: Escape Room Math Breakout Game
This breakout escape room is a fun way for students to test their skills with probability. Important: (How to Make Completely Digital)This product normally requires the printing of the questions to accompany a digital form for students to input answers. But if you follow a couple simple steps, this can be made entirely digital! Just use the following tool:https://smallpdf.com/split-pdf(choose "extract pages")to extract the pages containing the questions into its own PDF. You can then upload t
Subjects:
Grades:
4th - 6th
Types:
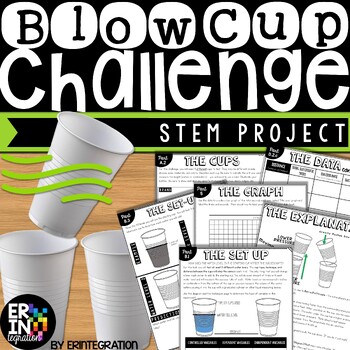
Blow Cup STEM Challenge and Scientific Method Project
The Blow Cup Challenge is now a STEM activity with this engaging science project inspired by the viral video where students try to blow one cup into another cup. Great low-prep way to teach the scientific method, variables and review math skills!This self-paced, multi-part Blow Cup STEM challenge is print-and-go. Each activity sheet guides students through the project. STEM Challenge Overview:Students will use the included visual directions, graphic organizers, charts, and activities to...Deter
Subjects:
Grades:
3rd - 6th
Types:
NGSS:
MS-PS2-2
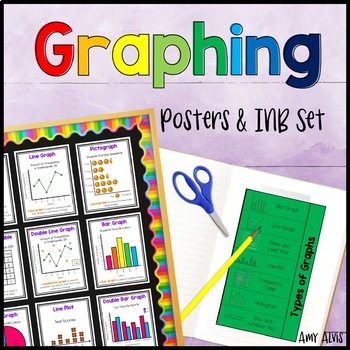
Graphing Posters & Interactive Notebook Bar Graph Picture Graph Line Plot
This poster or anchor chart and interactive notebook (INB) set includes FOURTEEN posters covering bar graphs, double bar graph, pictographs, picture graph, line graphs, double line graph, line plot, circle graphs, frequency tables, sector graph, stem and leaf plots, histograms, dot plots, parts of a graph and box and whisker plots. This set also includes SIX different foldable interactive notebook (INB) pages (that you print and put into a paper notebook) for students to take notes as well as a
Subjects:
Grades:
2nd - 5th
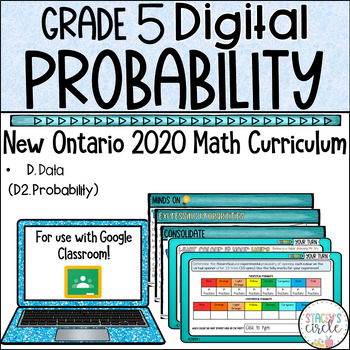
Grade 5 Probability 2020 Ontario Math Digital Googles Slides : D . Data
This resource includes a comprehensive Grade 5 Ontario Math Probability curriculum unit including lessons, activities, assessment and social emotional learning skills.This unit covers EVERY SPECIFIC Expectation from the 2020 Ontario D2. Probability (D. Data) strand. WHY BUY THIS PRODUCT OVER OTHERS?My vision for teaching math is always "Don't just tell the story, let the students become part of the story".Students will be walked through curriculum concepts step-by-step in easy-to-understand lang
Subjects:
Grades:
4th - 6th
Types:
Analyzing Plots, Graphs, and Tables using Measures of Central Tendency
This product provides students the opportunity to analyze data presented in different ways. By making calculations and analyzing data, students make conjectures and justify them using mathematical reasoning and evidence!What is included?This product contains 8 student work pages. Each work page contains a set of data displayed graphically with accompanying questions. The data displays included are 2 dot plots, 2 bar graphs, 2 frequency tables, and 2 stem-and-leaf plots. Students are required
Subjects:
Grades:
5th - 11th
Types:
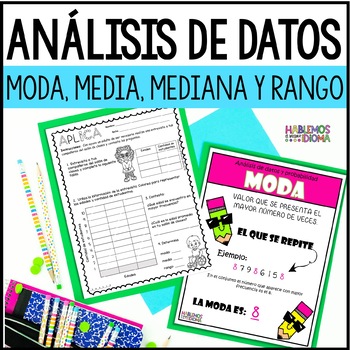
Análisis de datos moda, media, mediana y rango | Interpretación gráficas
¿Necesitas actividades para trabajar con tus estudiantes de grados primarios el análisis de datos (moda, media, mediana y rango) e interpretación de gráficas de una forma sencilla y divertida? Este recurso incluye carteles, hojas de trabajo, plegables para libreta interactiva y más.El siguiente recurso se llevó a cabo con la intención de ofrecer acceso curricular a la destreza de una forma sencilla y atractiva para el estudiante. El recurso se desarrolló para un aula inclusiva está dirigido a
Subjects:
Grades:
4th - 8th
Mean Median Mode and Range Exploration Lab & Graphing Activity
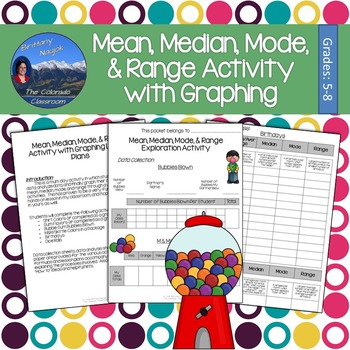
Mean, median, mode, and range are explored in this activity lesson pack complete with lesson plans, student packets, and graphing pages. You and your students will tackle these four important measures of central tendency through a fun lab activity involving bubble gum, M&Ms, birthdays, dice, and more. Students will collect data, analyze their data, and then graph their results all while learning about the mean, median, mode, and range of various scenarios.This activity is prepared and read
Subjects:
Grades:
5th - 8th
Types:
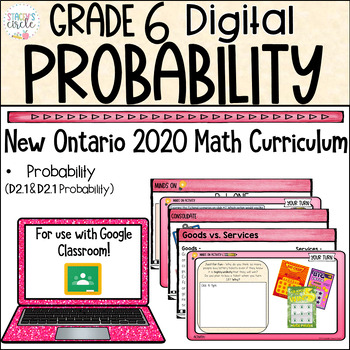
Grade 6 Ontario Math Probability Unit Digital Slides
Are you looking for an engaging and relatable way to teach your students concepts from the entire Grade 6 Ontario Math Probability strand? Your search ends here. WHY BUY THIS PRODUCT OVER OTHERS?My vision for teaching math is always "Don't just tell the story, let the students experience the story first hand. HOW?Students will be walked through curriculum concepts step-by-step in easy-to-understand language using identifiable and relatable problemsRather than mostly instructional slides, this pr
Subjects:
Grades:
5th - 7th
Types:
Also included in: Grade 6 Ontario Math Curriculum FULL YEAR Digital Slides Platinum Bundle
Mean, Median, Mode, Range Activity Bundle Math Centers
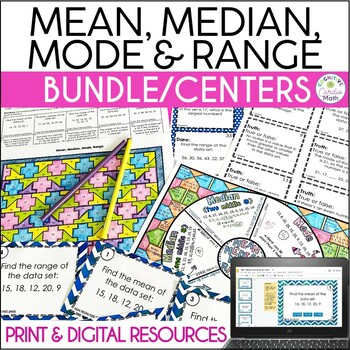
Use these mean, median, mode and range resources for your upper elementary or middle school math centers, homework, or independent practice! Some print and some digital.There are both group and independent activities to keep your students active and engaged.The resources include Truth or Dare game, Color by Number, Footloose Task Cards, and Math Wheel for taking notes.In these mean, median, mode, range resources, problems require students to:Find mean, median, mode or range of data setsFind a mi
Subjects:
Grades:
5th - 6th
Types:
Mean, Median, Mode, and Range (Bundled Unit) - Distance Learning
This is an enjoyable, interactive, and engaging bundled unit covering mean, median, mode, and range (and introduces outliers). This unit is great for 5th and 6th graders and 7th graders who struggle with these concepts.Included in this bundled unit:PowerPointAnimated and fun 4-part, 21-slide PowerPoint (multi-day use)-Part 1 – The Meaning of Mean-Part 2 – Getting in the Middle of Median-Part 3 – Making the Most of Mode-Part 4 – Home, Home on the RangeEach section offers plenty of practice probl
Subjects:
Grades:
5th - 7th
Probability and Tree Diagrams: A 78-Page Activity Resource
Updated 2017: Fonts have changed for better legibility and background changes.
This 78-page product is designed to teach, practice, review, and assess students’ knowledge of probability and tree diagrams. Besides lots of activities on probability, it also integrates students practicing converting fractions to decimals to percents in several activities.
You will find quality activities that are designed to get students actively participating in their learning and having a blast while doing it.
Subjects:
Grades:
3rd - 7th
Types:
Geometry: Survey and Circle Graph Project Made Fun!
Circle Graph Geometry Activity - Everyone just wants their piece of the pie!This is a fun, multi-faceted project that will have your students creating and implementing a survey, converting their results using various mathematical operations, and creating a poster-sized circle graph incorporating various geometry skills.This Survey and Circle Graph Project Unit Includes:PowerPoint:-Fun, interactive, 3-part PowerPoint slide presentation that walks you and your students through the entire project f
Subjects:
Grades:
5th - 7th
Examining Effects of Outliers on Measures of Central Tendency
This 10-page document contains 3 real-life data sets. For each data set, students are guided through an exploration of how outliers in data affect mean, median, mode, and range. Each data set requires students to perform calculations and analyze data. Students will make conjectures and justify them in writing using mathematical reasoning and evidence.
At the end of the activity, students are asked several concluding questions that require them to analyze and evaluate their work. They focus
Subjects:
Grades:
5th - 9th
Types:
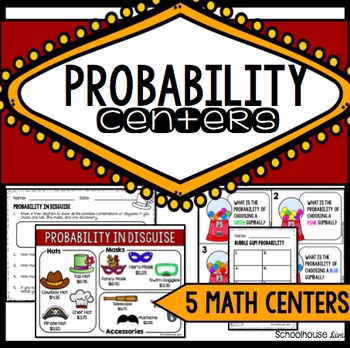
Probability Centers
Probability Centers for 3rd - 6th grades!
5 Probability Center Activities & Recording Sheets!
* Differentiated learning tasks included
Center 1
Probability in Disguise: Students use a list of costume pieces to create a tree diagram to determine the number of possible costume combinations. They also answer questions about the accessories (simple addition and subtraction of money).
** Color & BW version!
Center 2
Ice Cream Outcomes: Students use ice cream cut-outs to create an outcom
Subjects:
Grades:
3rd - 6th
Types:
CSI: Representing Data Activity - Printable & Digital Review Game
Nothing like a good criminal investigation to liven up data analysis! In this project, students will work in teams to investigate the culprit of six fictional thefts. The criminal has left six messages, layered with practice. Teams will work to build a case and present their findings to the court. Hopefully they are convincing enough to win the verdict.This is a elementary unit with a puzzle solving hook causes many different students to engage in solving traditionally mundane problems. 4th and
Subjects:
Grades:
3rd - 6th
Types:
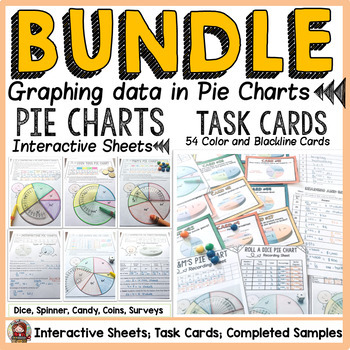
PIE CHARTS/PIE CIRCLE GRAPHS TASK CARDS AND {NO PREP} SHEETS BUNDLE
If you would like to teach a unit on pie charts using a combination of task cards and print-n- go activity sheets, then this activity pack fits the purpose. Please note that content in both worksheets and task cards is the same. You may have students work on the task cards at a center and then send the worksheets home for reinforcement or use them as an assessment tool to assess taught content or review concepts.***********************************************************************►► Details on
Subjects:
Grades:
3rd - 6th
Types:
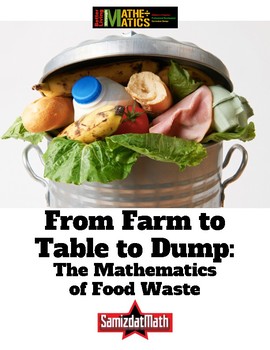
Food Waste and Mathematics: From Farm to Table to Dump
Here's a very uncomfortable fact: it takes 4 pounds of potatoes to make 1 pound of potato chips. That means that for every 1 pound bag of potato chips you eat, 3 pounds of potatoes have to be thrown away. What a waste of food! This is a series of activities that looks at the hidden world of food waste. It includes a look at how much food is wasted as it is "processed" into finished products like french fries and potato chips. It also includes mathematical activities where students calculate how
Subjects:
Grades:
5th - 12th, Adult Education
Types:
CSET- MATH DOMAIN 1-4
STUDY GUIDE CSET MULTIPLE SUBJECTSMath Domain 1-4NUMBER SENSEALGEBRA & FUNCTIONSMEASUREMENT & GEOMETRYPROBABLITY & STATISTICS
Subjects:
Grades:
K - 6th
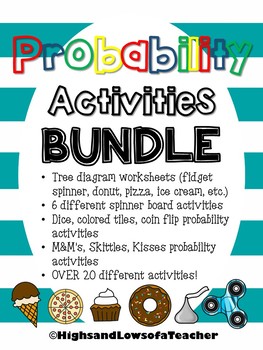
Probability Activity BUNDLE
Buy this bundle and save $!What's included in this bundle--Over 20 different activities-Fidget spinner probability activities-M&M's, Skittles, and Kisses probability activities-Dice, coin flip, colored tiles probability activities-Probability statement worksheets-Tree diagram worksheets-BONUS- fidget spinner and water bottle flip line plot worksheetsFidget Spinner MathTree Diagram WorksheetsSweets Probability ActivitiesColored Tiles, Coin Flip, Dice ActivitiesFREE Water Bottle Flip Line Plot
Subjects:
Grades:
3rd - 8th
Types:
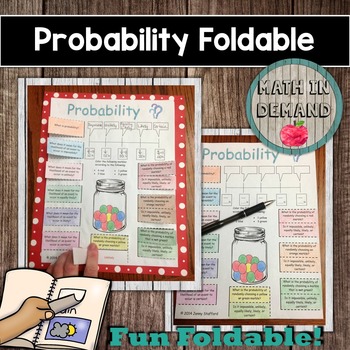
Probability Foldable
Included is a foldable on Probability. This is a great study guide or graphic organizer for any grade level learning about Probability. I have included step by step instructions that can be projected on the white board so that students can easily follow along. Your students will love making this foldable!
CLICK HERE to see my math foldables bundle!
Subjects:
Grades:
5th - 8th
Types:
Also included in: Math Foldables Bundle (Includes All Math Wheel Foldables)
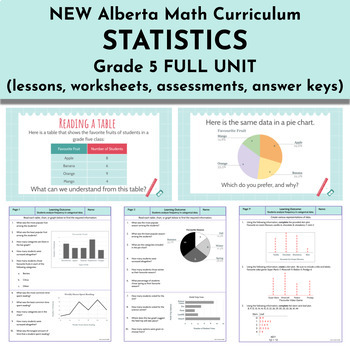
Statistics Unit - NEW Alberta Math Curriculum Grade 5
This Grade 5 Statistics resource is intended to meet the NEW 2023 Alberta Math curriculum expectations. Learning Outcome: Students analyze frequency in categorical data.Skills and Procedures:Examine categorized data in tables and graphs.Determine frequency for each category of a set of data by counting individual data points.Identify the mode in various representations of data.Recognize data sets with no mode, one mode, or multiple modes.Justify possible answers to a statistical question using m
Subjects:
Grades:
5th
Types:
Also included in: FULL YEAR Alberta Math Curriculum - Grade 5
Showing 1-24 of 445 results


