285 results
Free 4th grade statistics resources
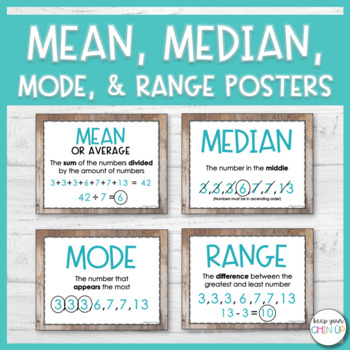
Mean, Median, Mode, and Range Posters
Looking for a visual to help your students with determining the mean, median, mode, and range of a data set? These simple posters are designed to help your students remember key words and formulas for each of the terms.
WHAT'S INCLUDED?
► 2 Options for printing (color or black & white)
► Posters for the terms: mean, median, mode, range, and data set
► Vocabulary worksheet
► Practice worksheet
Subjects:
Grades:
4th - 6th
Types:
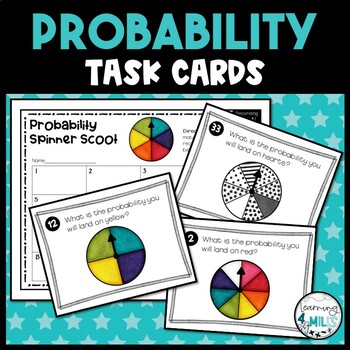
Probability Task Cards
Probability SCOOT Game is an easy way to get students moving while learning probability in a fun way. This resource includes 16 SCOOT cards that show eighths, sixths, fourths, thirds, and halves. All cards are in spinner form and come in color and black/white. Included-16 Scoot Cards- Recording SheetClick Here for the full product with a Math Book!__________________________________________________________________Feedback and Reviews♥I would love to hear how you use these activities in your class
Subjects:
Grades:
2nd - 4th
Types:
Mean, Mode, Range, and Median Football Statistics MATH CENTER **FREEBIE**
Here is a fun way to have your students practice mean, median, mode and range with a FREEBIE! :) Students will use work mats with four football teams scores on it. They will use the worksheets that go with it to answer a bunch of questions regarding mean, median, mode and range.
****You may also like my MONEY SAVING 6th Grade Math CCSS MEGA BUNDLE***
Included in this file:
2 work mats (one black and white & one in color)
2 worksheets on mean, median, mode and range
2 answer keys
If y
Subjects:
Grades:
4th - 6th
Types:
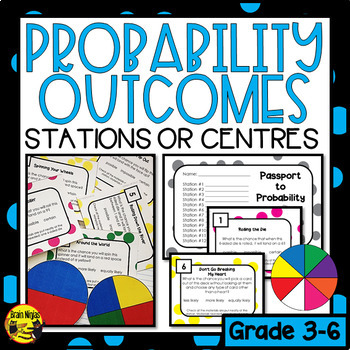
Describing Probability Outcomes Task Cards
Your students can explore probability by moving through twelve stations that each pose a question which can be answered with more likely, less likely, equally likely, possible, impossible or certain. This easy to use product includes:instructions to set up the stations (or use the activities as task cards).templates to make spinners (both in colour and ink-saving options).student recording pages.task cards for twelve stations (with materials listed on each card).answer key.One questions reads: W
Subjects:
Grades:
3rd - 6th
Types:
FREE Water Bottle Flip Line Plot Activity
Have your student flip water bottles and see how many times they successfully flip it! Record data and create a line plot!
Check out my other line plot activity here!
Fidget Spinner Line Plot
Subjects:
Grades:
3rd - 8th
Types:
Also included in: Probability Activity BUNDLE
Skittles Line Plot Activity
Suggestions for this lesson:
-Use this as an assessment piece based on the work you have already done in working on understanding line plots in your classroom
-Use this as a reward activity that is still curriculum based.
-Use this as a review for the end of a unit.
-Use this as an introduction to line plots in your classroom as a “hook.”
Things you will need:
-A class set of print outs from this packet for your class
-An anchor chart to explain to students how to create a line plot (I suggest
Subjects:
Grades:
2nd - 4th
Types:
FREE 2024 Super Bowl Fantasy Football Math Activity-Common Core
Note: This resource will be updated after the Super Bowl teams are set.As Peyton Manning would say, "HURRY, HURRY!!!!" Don't miss out on this fun, engaging resource to get your students involved in the excitement of Super Bowl 58!With this resource, students work alone or in teams to construct a fantasy football roster to compete against one another, and you, during the big game in Las Vegas on February 11th. Included this year is now a digital option available to use in distance learning sett
Subjects:
Grades:
3rd - 6th
Types:
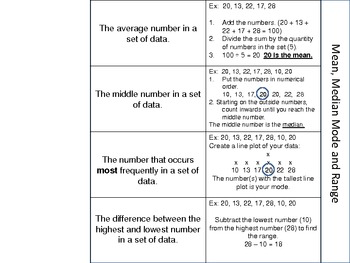
Mean, Median, Mode & Range Math Foldable
You can use this foldable to introduce mean, median, mode and range. Students can easily paste it into their notebooks or file it away in a math folder!
Subjects:
Grades:
4th - 6th
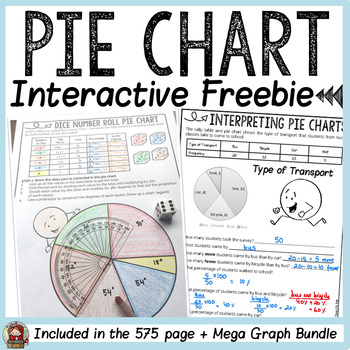
PIE CHARTS/ PIE GRAPHS/ CIRCLE GRAPHS FREEBIE
This freebie on interpreting and creating a pie chart is a sampler activity from the Mega Graphs Bundle.ITEMS INCLUDED✅ A poster defining a Pie Chart.✅ A one-page activity sheet to interpret collated data on mode of transport to school.✅ A one-page activity sheet that requires students to roll a dice and collect and interpret data. They will also find the percent and proportion of each sector to construct a pie chart using a protractor.✅ Answer key/completed sample of each graphing activity.****
Subjects:
Grades:
2nd - 6th
Types:
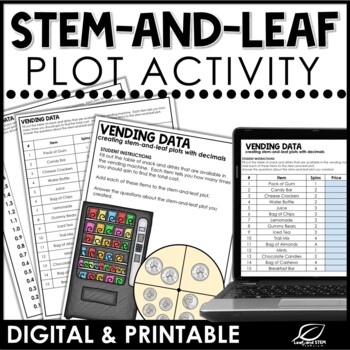
Stem-and-Leaf Plots Activity | Math Center | Printable & Google Sheets | FREE
Have your students practice writing decimals while creating a stem-and-leaf plot! Students spin to find the prices of items for sale in a vending machine and create a stem-and-leaf plot with this data.Students will also answer one and two step problems about the data represented in the stem-and-leaf plot.What's included?A coin spinner boardProduct listStem-and-leaf plot templateQuestion pageMultiple-choice exit ticketOpen-ended exit ticketDigital Google Sheets™ version of the activitiesThis mat
Subjects:
Grades:
4th - 6th
Types:
Teaching Probability and Risk with SKUNK
Teaching Probability and Risk with SKUNK
SKUNK is a classroom classic – it involves risk, reward, and math that teaches concepts like probability and chance. On top of the intrinsic reward of winning, and the excitement of chance, SKUNK is an incredibly low-prep game that requires no more than paper and dice!
Teaching the Game of SKUNK....
Common Core Standards:
This activity and a lesson plan explaining it meets common core standards for Statistics and Probability. This lesson works best f
Subjects:
Grades:
4th - 9th
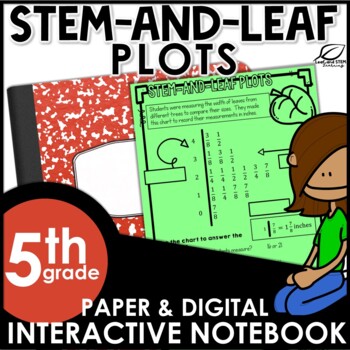
Stem-and-Leaf Plots Interactive Notebook Set | FREE | Distance Learning
Introduce creating and solving one-step and two-step problems using stem and leaf plots. This interactive math notebook set focuses on the Texas TEKS 5.9A and 5.9C. Parts of this set are also appropriate for use with Texas TEKS 4.9A and 4.9B. The stem-and-leaf plots included in this math interactive notebook set use whole numbers, fractions, and decimal values. Also included are a practice activity and a writing activity as well as a 4 question formative test prep style assessment. This fun
Subjects:
Grades:
4th - 6th
Also included in: 5th Grade Math Interactive Notebook - ALL TEKS - ALL CCSS
Mean, Median, Mode, and Range Lesson Plans, Task Cards, and Activities
This product contains 5 days worth of activities and worksheets, pre-test, and post test, answer keys, task cards, and a clever activity to help students distinguish between these different types of averages that I guarantee you have never seen before.
This item has beed revised as of 2/21/2014. I have added "I have...Who has?" that includes 20 cards that is intended to review mean, median, mode, and range plus other terms. Enjoy!
Subjects:
Grades:
3rd - 6th
Types:
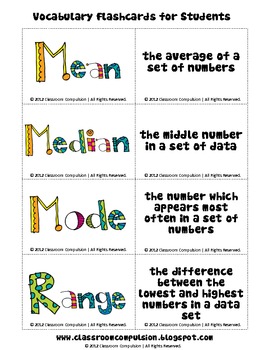
FREE Mean Median Mode Range Fun Flashcards
This is a freebie from my Mean, Median, Mode, and Range Pack. These are fun, colorful flashcards that your students can use to help them learn math vocabulary.
Subjects:
Grades:
3rd - 9th
Types:
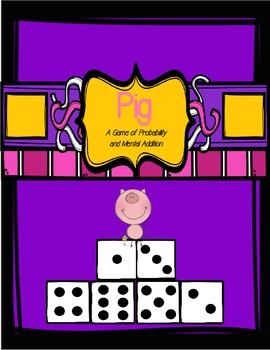
Pig - A Mental Addition and Probability Game
The game of Pig is designed to help students develop and practice their mental addition skills. It can also be used to introduce and explore the concept of probability.
The object of the game is to be the first player to achieve a score of 100 or more.
On a player’s turn, he/she will roll two dice as many times as he/she likes and will mentally keep a running total of the sums that they roll. For example, if a player rolled a 2 and 4 (6) and then 2 and 2 (4), his/her running total would be 1
Subjects:
Grades:
1st - 6th
Types:
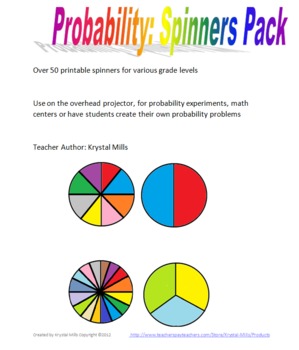
Probability Spinners Pack
This resource includes spinners for probability problems and experiments that could be used in various grades.
Included:
-blank spinners (2,3,4,5,6,8,10 and 16 spaces)
-numbered spinners (2,3,4,5,6,8, and 10 spaces)
-printable sheets (4 spinners to a page) of blank spinners with 2,3,4,5,6,8,10 and 16 spaces
-colored spinners (2,3,4,5,6,8,10 and 16 spaces)
Over 50 spinners that can be used with various grades and for various activities. Ready to print and go!
Teacher Author: Krystal Mills
pr
Subjects:
Grades:
3rd - 8th
Types:
Mean, Median, and Mode Activity Sheet
Need to teach mean, median, and mode, or just need some extra practice for it? Make it engaging with this activity page! Conduct fun data collection opportunities, such as timing students on a homemade obstacle course... or seeing how many marshmallows they can fit in their mouths! (my favorite!)
Did this with my 4th and 5th grade summer school students and it was a perfect review- they had a blast!
Download includes recording page for 4 sets of data and a definition page to fill in for refere
Subjects:
Grades:
4th - 6th
Types:
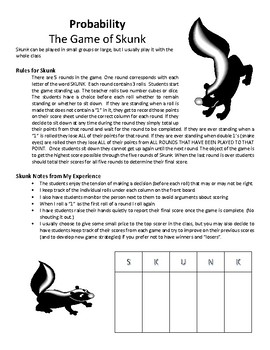
Probability - The Game of Skunk
Do you want a game your students will beg to play? This is a great game to introduce probability. The game is interactive and competitive which keeps the kids wanting to play. The game introduces the students to probability and an understanding of choice versus chance.
Subjects:
Grades:
4th - 7th
Types:
CCSS:
Probability Practice Galore!
A great resource for teaching Probability! These two mini-booklets contain large images to use for word study or as anchor charts, two worksheets involving spinners and probability lines, and extra probability worksheets. It's likely that these will come in handy!
Subjects:
Grades:
3rd - 6th
Types:
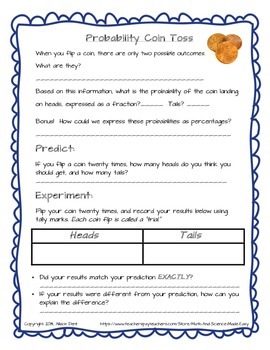
FREE Probability Activity: Coin Toss!
Use this engaging activity to teach students about probability. All you need is one penny per student, and you're on your way!
Students will toss their own penny and record their results, then the class will compile all of their coin toss results to demonstrate the importance of multiple trials in probability experiments.
Just print it out, pass out pennies, and watch your students explore math with excitement!
Be the first to know about my new discounts, freebies and product launches:
• Lo
Subjects:
Grades:
3rd - 5th
Types:
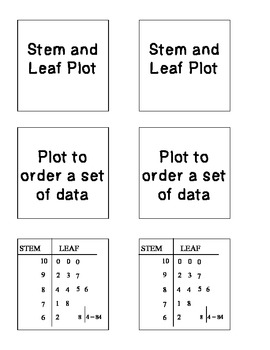
Types of Graphs Foldable-FREEBIE
Types of graphs foldable cards. Two per page. Great to use with a shutterfold.
Graphs included: Stem and Leaf, Line Plot, Line Graph, Bar Graph, Frequency Table, Circle Graph
Used for note taking purposes.
Subjects:
Grades:
3rd - 8th
Types:
Math Songs
This collection of 5 songs helps students remember key math concepts. The songs focus on the concepts order of operation, place value, long division, line geometry, and data (mode, median, and mean). All songs are sung to familiar tunes and are parodies of popular songs. Students love singing the songs and easily remember the concepts with these powerful mnemonic devices!
All the lyrics in this collection are original and written by Alexis Sergi (Math Mojo). I hope your students enjoy them!
Subjects:
Grades:
2nd - 10th
Types:
Data & Probability Scoot Game
This is a game I created to review data and probability. Students scoot around the room, answering questions, to review bar graphs, dot plots, tables, probability, and range. I play these review games with my students, and they love it!
Subjects:
Grades:
2nd - 5th
Types:
Shoe Size Dot Plot
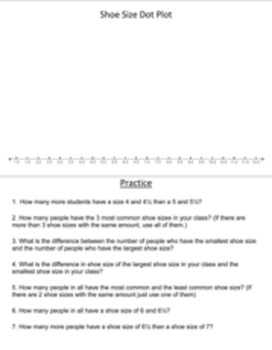
Introduce Dot Plots by using this activity in your classroom. Collect the information with your class and fill in the dot plot. There are also high level comprehension questions to go along with the dot plot to assess your students knowledge. This would also go into an interactive journal or notebook. This activity covers the NEW 2014-2015 Math TEK 4.9(A) summarize a data set with multiple categories using a frequency table, dot plot, pictograph, or bar graph with scaled intervals.
Subjects:
Grades:
3rd - 6th
Types:
CCSS:
Showing 1-24 of 285 results


