TPT
Total:
$0.00
Selected
Subjects
16 results

Science Common Core 8.SP.A.4 resources
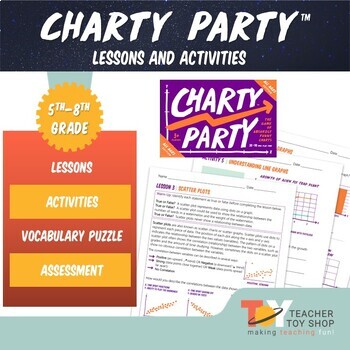
Preview of Graphing Lessons and Activities for Charty Party Game
Graphing Lessons and Activities for Charty Party Game

Created by
Teacher Toy Shop
Explore the engaging world of graphing with these Graphing Lessons and Activities for Charty Party Game, featuring nine interactive lessons that seamlessly blend learning with the excitement of a party game. Designed to teach line graphs, bar graphs, scatterplots, and more, these lessons are presented in kid-friendly language, making graphing concepts accessible and enjoyable for students. As they analyze graphs during the Charty Party™ game, students not only practice graphing but also delve in
Preview of Black History Month Bell Ringer Slide Presentation: Scientist Edition
Black History Month Bell Ringer Slide Presentation: Scientist Edition

Created by
Longing 2 Learn
Embark on a transformative journey of discovery with our Black History Month Bell Ringer Slide Presentation - Scientist Edition! Elevate your classroom experience throughout February as you delve into the remarkable contributions of black scientists and their impact on the world of science. This engaging resource is designed to captivate students, fostering an inclusive and enlightening atmosphere.Key Features:Scientist of the Day:Explore the life and accomplishments of a different black scienti
Preview of Exploring Tides. Graphing Data and Patterns Project
Exploring Tides. Graphing Data and Patterns Project

This activity helps students to see the connection between the moon phases and the height of Tides. In this activity students are required to graph the height of the highest tides and the lowest tides of each day given. Then they compare that with the calendar for the new and full moons. The patterns help them discover the relationship between moon phases and tides. Excellent reinforcer of graphing skills with a science connection.
Preview of Data Analysis Reading Graphs Sample

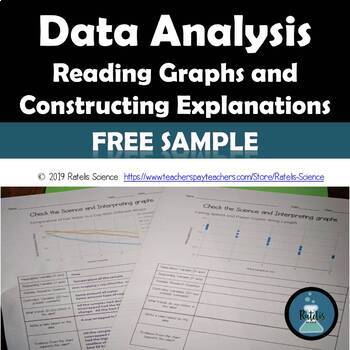
Data Analysis Reading Graphs Sample

Created by
Ratelis Science
Product DescriptionThis is a sample of the data analysis organizer I use for helping students analyze data and use that data to create a scientific explanation (claim, evidence and reasoning). I use this organizer with data from labs done by my classes. I collect the data in a spreadsheet and use it to make a larger data set for students to analyze as a weekly graphing practice. This also gives us the opportunity to talk about experimental design, trends in data and to work with larger data se
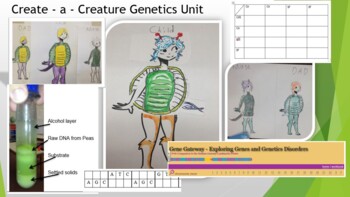
Preview of Create - a - Creature Genetics Unit

Create - a - Creature Genetics Unit

Created by
3D-PT
This whole unit covers the basics of genetics! It includes the Create a Creature lab, home genetic test, Punnet Squares, webquest, and final test!You can also extract DNA from dried peas; practice reading DNA and RNA; explore genetic disorders through the Human Genome Project webquest; and explore pedigree charts! You will have to create your own shell and tail pieces this. The original artist has gone on to draw a Google doodle ! You can also have the students design their own shell / tails. Th
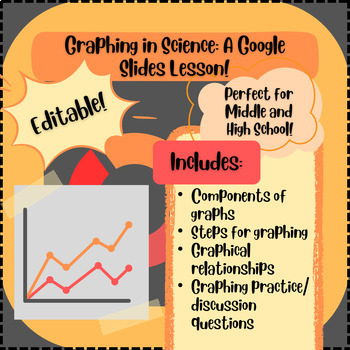
Preview of Graphing in Science: A Google Slides Lesson PLUS Guided Notes Handout!
Graphing in Science: A Google Slides Lesson PLUS Guided Notes Handout!

This EDITABLE Google slides (powerpoint) presentation AND guided notes handout covers all of the essential information students need to create and analyze graphs in science. This lesson is designed to refresh students on the concepts of creating graphs using scientific data, analyzing relationships between independent and dependent variables, and includes lots of examples and practice opportunities! This lesson can be used to introduce the important concepts of graphing in science, or it can be
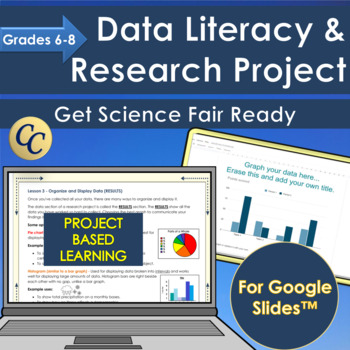
Preview of Get Science Fair Ready! Project Based Learning Data Literacy for Middles School
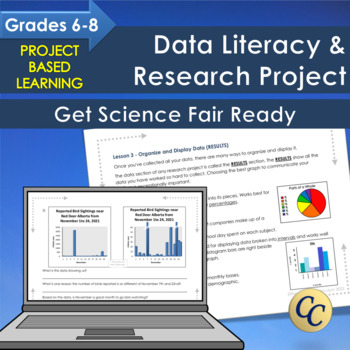
Get Science Fair Ready! Project Based Learning Data Literacy for Middles School

Science fair project that helps you teach data management, statistics and probability. Real data and meaningful science! The data literacy and research project covers everything middle school students need to know about collecting and interpreting data for their own animal observation observation project. Great for science fairs! Learn about collecting objective, non-bias data and how to recognize it in the real world. → Everything is included to have students learn about data, collect data and
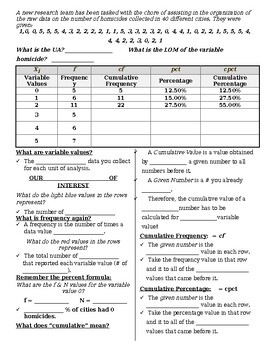
Preview of Univariate Stats: Frequency Distribution Table, Animated PPT w/ Scaffolded Notes
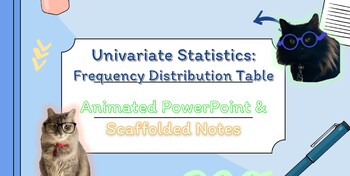
Univariate Stats: Frequency Distribution Table, Animated PPT w/ Scaffolded Notes

This Univariate Stats: Frequency Distribution Table resource contains scaffolded note pages that correspond to an interactive PowerPoint for your scientific method or statistics unit. There is a Tip & Tricks slide and corresponding note page that compiles feedback, notes, and helpful information I have personally seen benefit my students.Please be aware that this lesson was designed for a criminal justice-based statistics course; as such, topics and applied word problems use related themes.P
Preview of Constants, Variables, & Level of Measurement Animated PPT w/ Scaffolded Notes

Constants, Variables, & Level of Measurement Animated PPT w/ Scaffolded Notes
This constants, variables, and level of measurement resource contains an interactive and animated PowerPoint with matching scaffolded style notes for your scientific method or statistics unit. There is a Tip & Tricks slide and corresponding note page that compiles feedback, notes, and helpful information I have personally seen benefit my students.Please be aware that this lesson was designed for a criminal justice-based statistics course; as such, topics and applied word problems use related
Preview of Univariate Stats: Frequency Distribution Table, Animated PPW & Knowledge Checks
Univariate Stats: Frequency Distribution Table, Animated PPW & Knowledge Checks

This Univariate Statistics: Frequency Distribution Table resource contains an interactive and animated PowerPoint for your scientific method or statistics unit. You can also purchase the matching scaffolded notes. There is a Tip & Tricks slide and corresponding note page that compiles feedback, notes, and helpful information I have personally seen benefit my students.Please be aware that this lesson was designed for a criminal justice-based statistics course; as such, topics and applied word
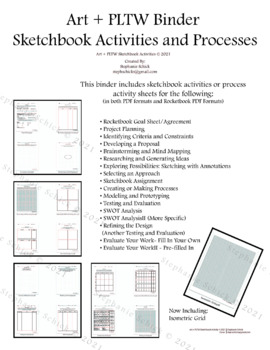
Preview of PLTW, Science and Art Processes and Activities Binder
PLTW, Science and Art Processes and Activities Binder

Created by
Winter Studios
Art + PLTW + Science BinderSketchbook Activities and ProcessesThis binder includes (in both PDF formats and Rocketbook PDF Formats) sketchbook activities or process activity sheets for the following:• Rocketbook Goal Sheet/Agreement• Project Planning• Identifying Criteria and Constraints• Developing a Proposal• Brainstorming and Mind Mapping• Researching and Generating Ideas• Exploring Possibilities: Sketching with Annotations• Selecting an Approach• Sketchbook Assignment• Creating or Making Pro
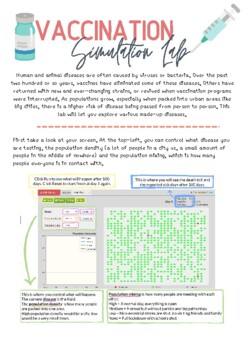
Preview of COVID-19 Simulation Lab

COVID-19 Simulation Lab

Created by
Iowan Abroad
Students go to the following website and follow the guide to answer the questions. They look specifically at why social distancing and staying at home works, how population density affects the spread of a virus and how vaccinations can slow the spread. They will answer questions about their thoughts on vaccinations and if they should be required to have one. Website: https://www.learner.org/wp-content/interactive/envsci/disease/disease.html
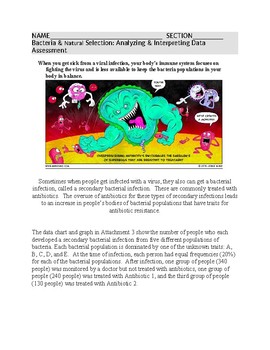
Preview of Analyzing Natural Selection Data of bacteria-Middle School NGSS

Analyzing Natural Selection Data of bacteria-Middle School NGSS

Focus on the NGSS cross cutting concept of analyzing data for DCI SCI-MS-LS4-6Students will analyze and interpret a data table and graphical representations of bacteria trait data associated with antibiotic resistance. Students will be able to use data to make predictions, and write a scientific argument for which trait would be the antibiotic resistant bacteria based on data.
Preview of Teaching with Baseball Statistics

Teaching with Baseball Statistics

Created by
Cecile Greene
I use this activity to teach my science students how to model an idea using data. Students learn to predict the outcomes of a baseball pitcher based on their last 3 years of stats. Students learn to analyze their data and determine trends in the data. Students also learn to compare data from their pitcher to other students' pitchers (collaboration). Students also must be able to/learn to accurately graph their data. There is also a research component as students must research their pitcher's
Preview of Get Science Fair Ready! Project Based Learning Data Literacy with Google Slides
Get Science Fair Ready! Project Based Learning Data Literacy with Google Slides

Science fair project that helps you teach data management. Middle school data literacy and research project covers everything middle school students need to know about collecting and interpreting data for their own animal observation observation project. Great for science fairs! Learn about collecting objective, non-bias data and how to recognize it in the real world.Everything is included to have students learn about data, collect data and present a meaningful research project.Students can pers
Preview of Univariate Stats: Frequency Distribution Table, Scaffolded Notes, Animated PPW

Univariate Stats: Frequency Distribution Table, Scaffolded Notes, Animated PPW

This Univariate Stats: Frequency Distribution Table resource contains scaffolded note pages that correspond to an interactive PowerPoint for your scientific method or statistics unit. There is a Tip & Tricks slide and corresponding note page that compiles feedback, notes, and helpful information I have personally seen benefit my students.Please be aware that this lesson was designed for a criminal justice-based statistics course; as such, topics and applied word problems use related themes.S
Showing 1-16 of 16 results

Find Science resources | TPT

Importance of learning science

Learning science is particularly important for students as it equips them with the essential knowledge and skills to make sense of the world around them. Science education is not just about memorizing facts. It fosters critical thinking, inquiry, and problem-solving abilities. These skills are not only useful in school but also in everyday life beyond the classroom.

Benefits of learning science

Learning science offers many benefits to students both in school and beyond. In fact, it helps students:

  • Question the world around them and seek evidence-based explanations
  • Cultivate their ability to observe, experiment, and analyze data
  • Nurture a sense of curiosity, awe, and wonder about the natural world
  • Understand natural phenomena and the laws that govern the universe

With a solid foundation in science, teachers can help empower students to think critically, solve problems, make informed decisions, and engage with the world around them in meaningful ways.

Teaching with science resources

One of the best parts about science class is all of the possibilities for hands-on, collaborative learning! Think: labs, experiments, inquiry-based activities, and design challenges. These activities encourage students to explore scientific concepts by observing, asking questions, and conducting investigations. Additionally, with small group centers, students can engage in group experiments, discussions, and projects that require them to collaborate, share ideas, and solve problems together.

Discover printable and digital science resources

If you’re a teacher or parent looking for printable or digital science resources, TPT has an extensive array of instructional materials for every learning need, topic, or grade level. Whether you're learning about plant parts or butterfly life cycles, or exploring advanced topics like the anatomy of a cell or Newton’s laws of motion, we've got you covered.

On TPT, science resources come in various forms: from labs and worksheets to craftivities and doodle notes. They can be used to enhance learning, assess a student’s mastery of science concepts, or to reteach a tricky topic. With plenty of TPT resources at your fingertips, teaching and learning science will be so much easier. Plus, you can expand students’ knowledge even further by exploring TPT math resources, which are frequently paired with science lessons.

Frequently asked questions about teaching science

What types of science lessons are available on TPT?

There are many different types of science resources sold by Sellers on TPT. Some popular science lessons include biology, earth sciences, chemistry, environment, engineering, and anatomy.

How do I find science lessons on TPT?

Educators can save time preparing science lessons with resources created by experienced teachers. Simply start a search for science resources on the TPT marketplace, and filter by grade level, price, and/or resource type to find materials that've been proven to work in classrooms like yours. No matter what you’re teaching, there are plenty of science lessons and activities sold by Sellers on TPT that are tailored to meet your students' skill levels.

How can I make my science lessons fun and engaging?

Students learn best when they're engaged! Sprinkle a little fun into your science lessons and make them feel like real scientists by investigating everyday objects, exploring the world outside the classroom, and doing hands-on and collaborative experiments and design challenges.