81 results
4th grade statistics interactive notebooks
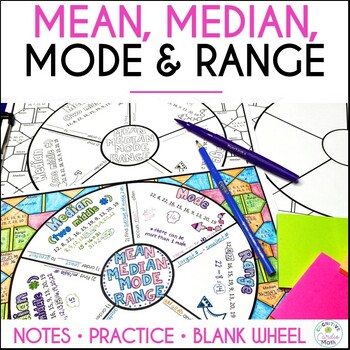
Mean, Median, Mode, Range Math Doodle Wheel | Notes and Practice Activity
Use this mean, median, mode, range doodle math wheel for notes and practice. Introduce each data measurement type as you teach it, or, you can use the math wheel to review all of them at once.What is a math wheel? A math wheel is a type of graphic organizer where students can:Take notes/guided notes inside the math wheelUse color, drawing, and doodling to help create memory triggersComplete practice problems in the pattern around the wheel, andColor the background patternStudents can keep these
Subjects:
Grades:
4th - 6th
Also included in: Mean, Median, Mode, Range Activity Bundle Math Centers
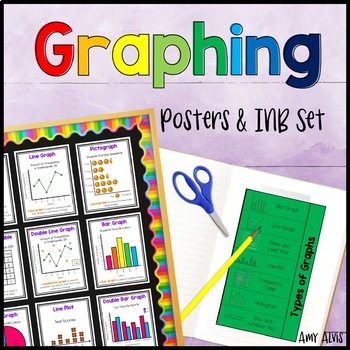
Graphing Posters & Interactive Notebook Bar Graph Picture Graph Line Plot
This poster or anchor chart and interactive notebook (INB) set includes FOURTEEN posters covering bar graphs, double bar graph, pictographs, picture graph, line graphs, double line graph, line plot, circle graphs, frequency tables, sector graph, stem and leaf plots, histograms, dot plots, parts of a graph and box and whisker plots. This set also includes SIX different foldable interactive notebook (INB) pages (that you print and put into a paper notebook) for students to take notes as well as a
Subjects:
Grades:
2nd - 5th
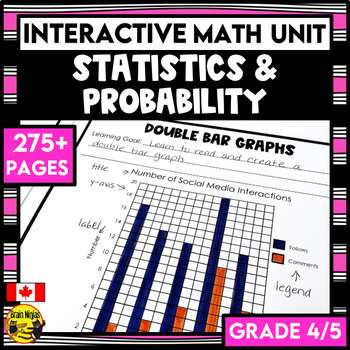
Statistics Graphing and Probability Interactive Math Unit | Grade 4/5
Stop searching for your statistics and graphing lessons. Everything you need to teach, practice, and assess bar graphs, pictographs, double graphs, stem and leaf plots and probability is included in this print-and-use unit. Your planning for your graphing unit is already done for you!This unit is part of the Full Year Interactive Math Unit Bundle for Grade 4/5. It comes with a bonus sequencing guide to help plan your whole year.This convenient resource includes:instructions for how to set up, as
Subjects:
Grades:
3rd - 5th
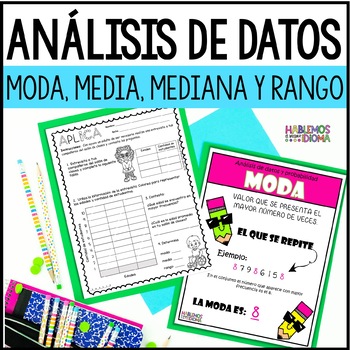
Análisis de datos moda, media, mediana y rango | Interpretación gráficas
¿Necesitas actividades para trabajar con tus estudiantes de grados primarios el análisis de datos (moda, media, mediana y rango) e interpretación de gráficas de una forma sencilla y divertida? Este recurso incluye carteles, hojas de trabajo, plegables para libreta interactiva y más.El siguiente recurso se llevó a cabo con la intención de ofrecer acceso curricular a la destreza de una forma sencilla y atractiva para el estudiante. El recurso se desarrolló para un aula inclusiva está dirigido a
Subjects:
Grades:
4th - 8th
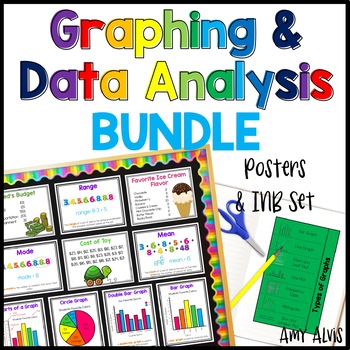
Graphing and Data Analysis Bundle Posters Interactive Notebook INB Anchor Chart
This bundle includes my Graphing Poster and Interactive Notebook (INB) set, my Data Analysis Poster and Interactive Notebook (INB) set and my Data Posters and Cards. Make sure to check the links below to see what comes with each set.This bundle includes:1. My best selling Graphing - Poster and INB Set.This poster and interactive notebook (INB) set includes FOURTEEN posters covering bar graphs, double bar graph, pictographs, picture graph, line graphs, double line graph, line plot, circle graphs
Subjects:
Grades:
2nd - 6th
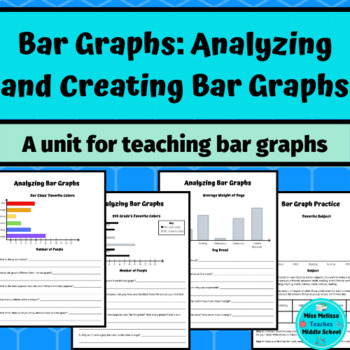
Statistics: Bar Graphs Mini Unit: Analyzing and Creating Bar Graphs
Students learn how to create a bar graph by first analyzing and reading bar graphs. Students analyze horizontal, vertical, and double bar graphs. They compare their qualities and answer questions about the data in the graphs and features of the graphs. They inspect titles, the quantities represented by the bars, and the x and y-axis values/labels. Once students are familiar with the concept and features of a bar graph, they create a bar graph from given data. This can be used as guided practice.
Subjects:
Grades:
4th - 7th
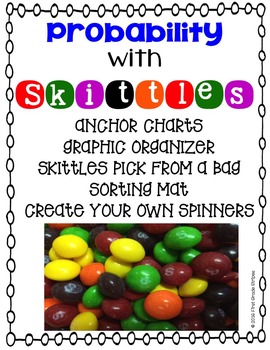
Probability with Skittles
Have fun teaching and learning about probability with Skittles!
File Contains:
*anchor charts (vocabulary words-color and b/w- words include certain, possible, most likely, least likely, and impossible) These can be used for interactive journals too.
*graphic organizer – Probability is, has
*activity 1 (classify & count Skittles, then record the number of tally marks, number, and the fraction that represents each color, questions are also listed)
*activity 2 (students will pick o
Subjects:
Grades:
1st - 8th
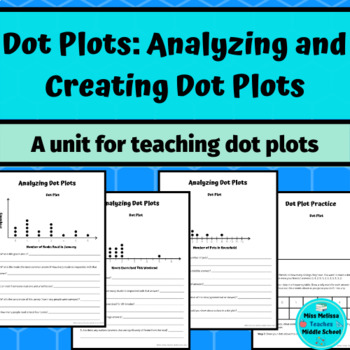
Teaching Dot Plots Mini Unit: Analyzing and Creating Dot Plots
Students learn how to create a dot plot by first analyzing dot plots. Students answer questions about the graphs to discover qualities about the dot plots. Students discover the axes, sample size, mean, median, mode, range, outliers, distribution, and other statistical terms through their analysis. Once students are familiar with the concept and features of a dot plot, they create their own from given data. This can be used as guided practice. After, students create a frequency table and dot plo
Subjects:
Grades:
4th - 6th
MEGA Grade 4 Math Bundle: Interactive Math Notebooks - All 13 Units Included
ALL 10 Interactive Math Notebooks - perfectly aligned with the NEW Grade 4 Math Alberta Program of Studies! ALL OUTCOMES are covered within these 10 interactive math notebooks!List of Units included:Place Value, Decimals, Addition & SubtractionPrime and Composite NumbersMultiplication & DivisionFractions & PercentagesAlgebraGeometry & AnglesMeasurement: AreaPatterns:TimeStatisticsWithin the units, many outcomes are combined into fewer lessons to make sure you have enough time to
Subjects:
Grades:
4th
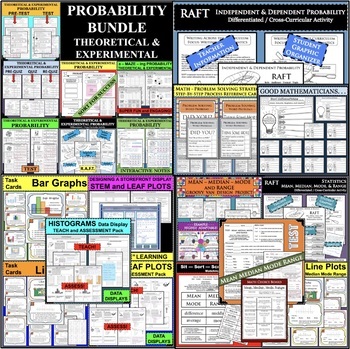
PROBABILITY AND STATISTICS MEGA GROWING BUNDLE of Activities PDF & GOOGLE SLIDES
A multitude of resources for PROBABILITY and STATISTICS! Engage your learners in fun, interactive, and differentiated ways. Hands-on learning opportunities for teaching, review, and assessment.Topics Included:DATA and GRAPHSMEAN, MEDIAN, MODE, RANGETHEORETICAL and EXPERIMENTAL PROBABILITYINDEPENDENT & DEPENDENT PROBABILITYEXTRA PRODUCTS TO DEVELOP DEEPER MATH UNDERSTANDING!These differentiated activities are NO PREP and READY TO GO! Great for sub (substitute lesson plans). They work wel
Subjects:
Grades:
4th - 9th
Math Interactive Notebook 4th Grade Texas Standards 4
STAAR WORKBOOK:
STAAR MATH PREP WORKBOOK
The 4th Grade Interactive Notebook / Journal has journal entries for Category 4.
Texas Standards:
Journal Entries and Activities
4.9A R Represent data on a frequency table, dot plot, stem and leaf
- entries for frequency table, dot plots with decimals, dot plots
with fractions, stem and leaf with tens and ones, stem and
leaf with two digits in the tens place and a digit in the ones
4.9B S Solve one and two step problems using
Subjects:
Grades:
4th
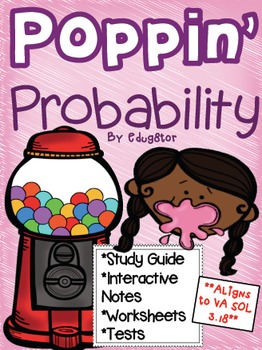
Probability Unit
**Aligns to VA SOL 3.18**
**Download preview to see examples from pack**
This pack includes the following to supplement your probability unit:
-Vocabulary Cards for: Certain, Likely, Equally Likely, Unlikely, Impossible
-Study Guide
-Interactive notes for: Introduction to Probability Vocabulary, Probability as a Fraction, Possible combinations using a tree diagram, Possible combinations using multiplication.
-6 worksheet to help practice different skills
-What are the Chances Sort
-20 task card
Subjects:
Grades:
2nd - 4th
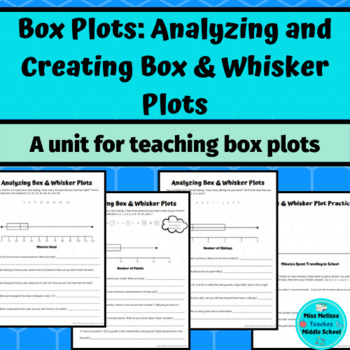
Statistics- Teaching Box Plots: Analyzing and Creating Box & Whisker Plots
Students learn how to create a box-and-whiskers plot (box plot) by first analyzing box plots. Students answer questions about the graphs to discover qualities about the box plot. Students discover the five number summary (minimum, quartile 1, quartile 2/median, quartile 3, and maximum), interquartile range, and other statistical terms through their analysis. Once students are familiar with the concept and features of a box plot, they create their own from given data. This can be used as guided p
Subjects:
Grades:
4th - 7th
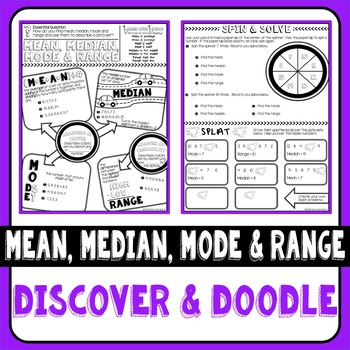
Mean, Median, Mode and Range Discover & Doodle
Looking for engaging notes that maximize class time and retention? Discover & Doodle pages are research based and combine words with visuals that boost student recall of information. They help students see what is important and visualize mathematical connections. Print full size for a binder, folder or handout. Need smaller size note pages to glue into a notebook? Follow the printing directions included to scale the pages down to notebook size.Discover & Doodle Pages Include⇒ Printi
Subjects:
Grades:
4th - 6th
Also included in: Statistics Discover & Doodle Bundle
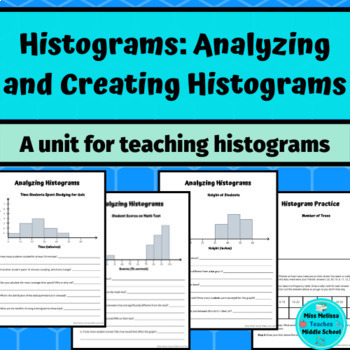
Statistics- Teaching Histograms Mini Unit: Analyzing and Creating Histograms
Students learn how to create a histogram by first analyzing histograms. Students answer questions about the graphs to discover qualities about the histogram. Students discover the axes, sample size, bins, range, distribution, and other statistical terms through their analysis. Once students are familiar with the concept and features of a histogram, they create their own from given data. This can be used as guided practice. After, students create a frequency table and histogram on their own using
Subjects:
Grades:
4th - 7th
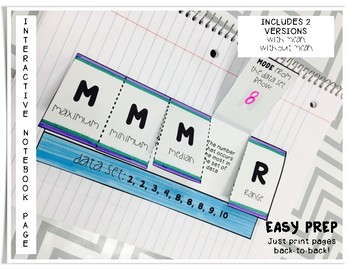
Mean, Median, Mode, Range Interactive Notebook Page (MMMR)
Use this foldable in an interactive notebook to reference the definition of MMMR terms, as well as review an example data set. This download includes two versions of the foldable: one that includes "mean", and one without "mean". Simply print the version you choose back-to-back. Student directions are located on the back of the foldable.
Subjects:
Grades:
4th - 5th
Types:
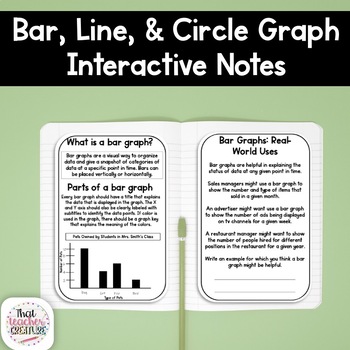
Bar, Line, and Circle Graph Interactive Notes
Make teaching bar, line, and circle graphs easier with these interactive notes! This no-prep set includes 3 sets of interactive notes perfect for exploring types of graphs. Quick and easy setup helps save you time and provides students with notes they need to understand the purpose, parts, and real-world uses of each type of graph. Here's what you'll get:purpose of a bar, line, and circle graphparts of a bar, line and circle graphreal world application of each type of graphguided practice - crea
Subjects:
Grades:
4th - 12th

Foldable- Line Plot, Bar Graph, Box-and-Whisker Plot, and Circle Graph
This foldable includes examples of four different graphs. The graphs included are the line plot, bar graph, box-and-whisker plot, and circle graph. There is a fill in the blank definition and an area devoted to brief practice of the analyzing of these graphs. Answer Key included.
Subjects:
Grades:
4th - 8th
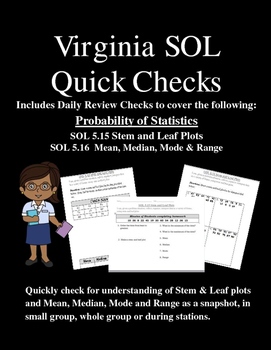
GRADE 5 MATH VIRGINIA SOL QUICK CHECKS: SOL 5.15/5.16
Virginia Quick Checks . Check for understanding of Probability and Statistics and VA Math SOL 5.15 Stem and Leaf Plots & VA Math SOL 5.16 MMMR - Mean, Median, Mode and Range. These quick checks will work well as warm ups, exit tickets or checks during teacher station. Students can glue these sheets inside of their Math notebooks and solve.
VIRGINIA SOL MATH TEST PREP
This product is designed to review and practice key concepts associated with the Virginia Standards of Learning (VA SOLs) in
Subjects:
Grades:
4th - 8th
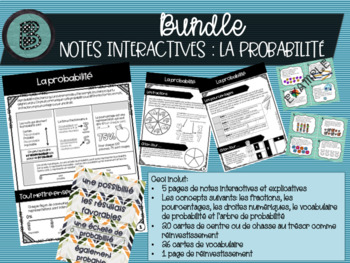
BUNDLE probabilité: notes interactives, cartes et vocabulaire
Voici 5 pages de notes interactives pour bien expliquer la probabilité en employant plusieurs concepts: les fractions, droite numérique, pourcentage, vocabulaire à l'étude et un arbre de probabilité. Ces notes permettent aux élèves d'étudier les concepts, ainsi que comprendre visuellement comment ils sont entre reliés. À la fin, il y a une feuille de réinvestissement. Ceci inclut mes cartes de probabilité qui pourraient être utilisé comme centre, ou activité de classe. Il y a 20 questions en tou
Subjects:
Grades:
4th - 7th
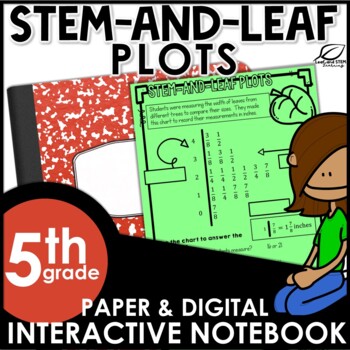
Stem-and-Leaf Plots Interactive Notebook Set | FREE | Distance Learning
Introduce creating and solving one-step and two-step problems using stem and leaf plots. This interactive math notebook set focuses on the Texas TEKS 5.9A and 5.9C. Parts of this set are also appropriate for use with Texas TEKS 4.9A and 4.9B. The stem-and-leaf plots included in this math interactive notebook set use whole numbers, fractions, and decimal values. Also included are a practice activity and a writing activity as well as a 4 question formative test prep style assessment. This fun
Subjects:
Grades:
4th - 6th
Also included in: 5th Grade Math Interactive Notebook - ALL TEKS - ALL CCSS
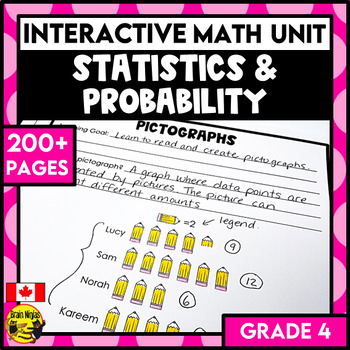
Statistics Graphing and Probability Interactive Math Unit | Grade 4
Stop searching for your statistics and graphing lessons. Everything you need to teach, practice, and assess bar graphs, pictographs, double graphs, stem and leaf plots and probability is included in this print-and-use unit. Your planning for your graphing unit is already done for you!This resource is part of our Full Year Bundle.This convenient resource includes:instructions for how to set up, assess, and use interactive notebooks. It has a version that doesn’t require cutting and gluing if you’
Subjects:
Grades:
4th
Also included in: Math Unit Year Long Bundle | Grade 4 | Interactive Math Units for Canada
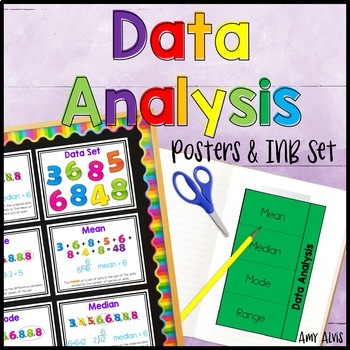
Data Analysis Posters and Graphic Organizer INB Set Anchor Chart
This poster and interactive notebook (INB) set covers data set, mean, median, mode and range. This set includes a ONE interactive foldable graphic organizer (INB), FIVE posters (8.5 X 11) and THREE versions of the data set cards.The posters and data cards come in a color version as well as a black and white version.Thank you for looking,Amy Alvis
Subjects:
Grades:
4th - 6th
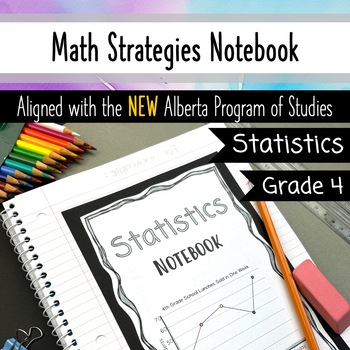
Statistics Unit - Grade 4 Math Notebook - Alberta Aligned Interactive Notebook
Grade 4 Math Strategies Notebook for your unit Statistics - all in one convenient student notebook!This interactive Statistics Notebook will serve as a practical, engaging resource that students will use and reference throughout the entire year. It covers ALL 7 of your BRAND NEW Statistics (Skills and Procedures) outcomes in grade 4 Alberta.In this resource you will find:A cover page for your Interactive Math notebook,A 'Statistics' title page for this section of your Math notebook,An ”I Can sta
Subjects:
Grades:
4th
Showing 1-24 of 81 results


