86 results
Common Core 8.SP.A.2 projects
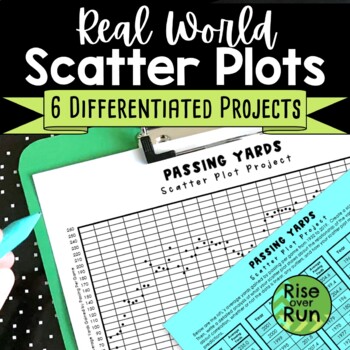
Scatter Plot Project with Real World Sports Data
Practice creating and analyzing scatter plots with these six differentiated real world projects. Students are provided statistics for a sport and must graph the data. Then, they write an analysis describing correlation, whether or not the data is linear, any outliers, and how the scatter plot might be used to make predictions. The scatterplots range from 38 points to 149 points, so they can be used to differentiate. The scatter plots will take a little time to plot, but they result in real
Subjects:
Grades:
8th - 9th
Types:
CCSS:
Also included in: 8th Grade Math Activities & Lessons Bundle for the Whole Year
Correlation All-Star -- Sports Data Analysis - 21st Century Math Project
Bring an authentic sports-based math project to your Algebra, Algebra 2 or PreCalculus classroom with Lines of Best Fit and Correlations! All in this 21st Century Math Project! Using data from the MLB, NBA, NFL and NHL students investigate correlations to some of sports most common questions like: "Do more shots result in more goals?" "Do hitters or pitchers have more impact on a team's wins?""What NFL stat is most strongly correlated with wins?" and the grand-daddy..."Can money buy championship
Subjects:
Grades:
7th - 12th
Types:
CCSS:
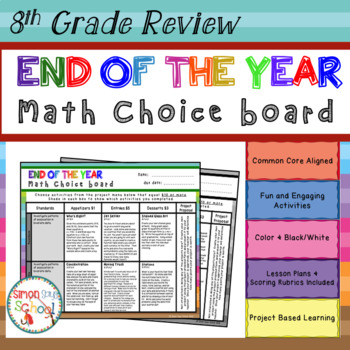
8th Grade Math Review Choice Board - End of the Year Math - Distance Learning
End of the Year Math Review Choice Board Activity– 8th Grade Standards– This math review choice board is an amazing differentiation tool that not only empowers students through choice but also meets their individual needs. At the same time, students are able to show their understanding of key 8th grade math concepts at a variety of TOK levels.This board contains three leveled activities for each domain: appetizer, entrée, and dessert. - Fractions - Geometry - Measurement - Numbers and O
Math March Madness Full Tournament Project {BUNDLE}
Harness the excitement of NCAA March Madness with this huge project for secondary math teachers that follows all stages of the tournament! This Common Core aligned bundle comes with bonus parts not sold individually in my store so you can create a rich immersion in the tournament, practice probability and statistics and learn some interesting new ones along the way! Save $3 plus get bonus content by bundling!You can pick and choose which parts you would like to incorporate, or follow my schedu
Subjects:
Grades:
6th - 12th, Higher Education
Types:
Math Projects Middle School Bundle for STEAM
Jump into middle school math concepts with this Art meets math bundle of creative math projects. Great for math lab days or stations. 8 Math meets arts lessons + a bonus resource of linear equations with Calder ($45 VALUE). Each project includes:- Teacher's guidelines- Background information on artist- Student handouts for each part of the project- Answer key (where applicable)- Editable rubric (where applicable)- Slides or artwork related to projectThis bundle includes:- Rational vs. Irratio
Subjects:
Grades:
6th - 8th
Types:
Math Choice Board Mega Pack - All 8th Grade Standards - Distance Learning
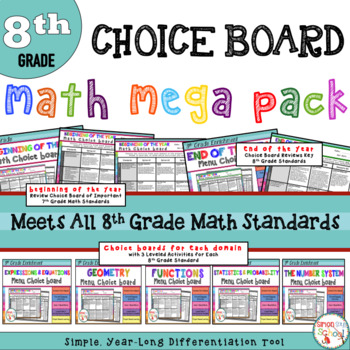
Math Choice Board Mega Pack – All 8th Grade Standards – Year Long – This choice board bundle is a simple, year-long differentiated tool for ALL 8th grade standards.This resource includes... - Beginning of the Year Math Review Choice Board – 8th Grade - Functions Enrichment Choice Board – 8th Grade - The Number System Enrichment Choice Board - 8th Grade - Expressions and Equations Enrichment Choice Board – 8th Grade - Geometry Enrichment Choice Board – 8th Grade - End of the Year
8th Grade Math Choice Boards Bundle - ALL STANDARDS - Distance Learning
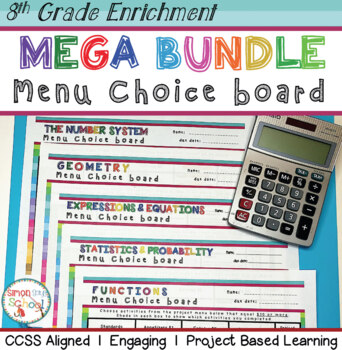
Math Enrichment Choice Board Bundle – All Eighth Grade Standards– These five enrichment menu projects are an amazing differentiation tool that not only empowers students through choice but also meets their individual needs. This resource includes all five of my 8th grade math enrichment choice board menu projects - Fractions - Geometry - Measurement - Numbers and Operations in Base Ten - Operations and Algebraic ThinkingEach board contains three leveled activities for each standard:
8th Grade Math - END OF YEAR PROJECT (EDITABLE!)
This is a great way to wrap up the year with an 8th grade math class! Students create a fun Review Book that asks them to summarize everything they've learned... while using lots of color and flexing their creativity! * TEACH MULTIPLE SUBJECTS? Check out these other End-of-Year Projects:Bundle of 6th, 7th & 8th Grade Math ($8 discount!)7th Grade Math6th Grade Math ALL of the Common Core 8th Grade math standards are covered! The packet attached starts with clear, page-by-page directions for t
Subjects:
Grades:
8th
Types:
Also included in: Middle School Math - End of Year Project BUNDLE!
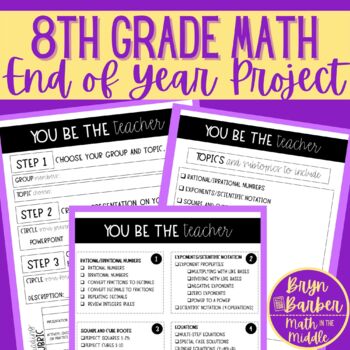
8th Grade Math End of Year Project - You Be the Teacher / Expert
This low-prep project is perfect for reviewing for state testing or end of year final exams. In this assignment, 8th grade math standards are broken into 12 sections. Students work with a partner or group to create a presentation and an activity/assessment to share with the class. This allows student groups to become "experts" at their content while presenting it for review to their peers.Topics include:Rational/irrational numbersExponent propertiesSquare and cube rootsFractions/decimal conversi
Grades:
8th
Types:
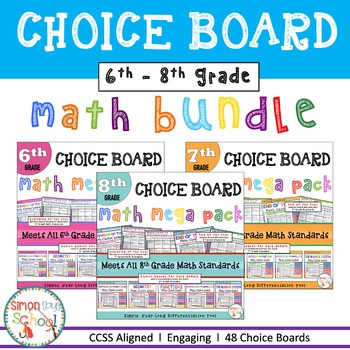
Middle School Math Choice Board Bundle for Distance Learning
Enrichment Math Choice Board Ultimate Bundle – ALL Middle School CCSS Standards – Year Long – This choice board bundle is a simple, year-long differentiated tool for ALL Standards. It is perfect for distance learning and includes… · Sixth Grade· Seven Grade· Eighth Grade This bundle includes 22 choice boards and each choice board menu project includes… - Sample Lesson Plans - Menu Choice Board - Project Proposal - Project Rubric - Presentation Rubric Beginning of the Year Math Review Choice Bo
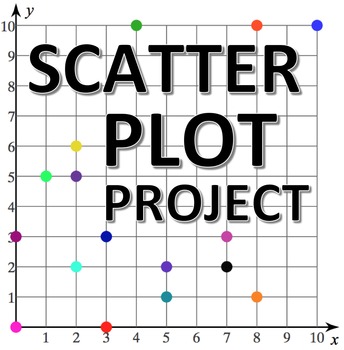
Scatter Plot Project
For this project, students develop their own questions to survey their classmates in order to create three different scatterplots (positive association, negative association, no association). Students will make predictions about how their quantitative variables are related to one another, and then will analyze the data to determine if their predictions were correct.
Download includes student directions, data collection pages, quantitative variable suggestion list, first quadrant graphs, ques
Seven Billion and Counting... -- Int'l Modeling - 21st Century Math Project
As the world's population has ballooned in the past three centuries researchers wait for the other pen to drop. This 21st Century Math Project investigates! Currently sitting at a cool 7 billion (and counting), researchers believe (based on their models) that the world's population will top out at 9.2 billion. It's time for your class to analyze the same data and make their own predictions. Which model best projects the world in 2050? I guess at the class's 38th year reunion you can find out.Thi
Subjects:
Grades:
7th - 12th
Types:
CCSS:
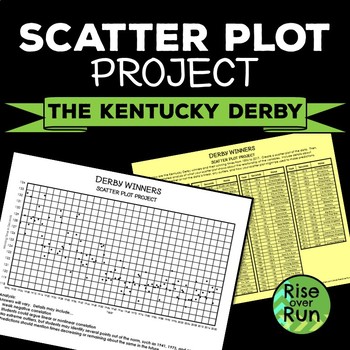
Scatterplot Project with Real World Stats from the Kentucky Derby
Practice creating and analyzing scatter plots with this project. Students are provided statistics for winning horses and must graph the data. Then, they write an analysis describing correlation, whether or not the data is linear, any outliers, and how the scatter plot might be used to make predictions. This is one of the projects in my Differentiated Scatter Plot Projects!Thank you for your interest in this resource from Rise over Run. Related Resources:Scatter Plot Practice WorksheetsScatter
Grades:
8th - 9th
Types:
CCSS:
Also included in: Algebra I Sub Plans Bundle with Activities
Scatter Plot Project using McDonald's Menu (8.SP.1 & 8.SP.2)
Students use a nutrition website to find the total grams of fat and calories of 15 McDonald's menu items. After making a table listing these items, students construct a scatter plot to display the data. Students then make a conclusion based on this scatter plot that include drawing a line of best fit if applicable and the type of correlation present (positive, negative, no correlation, high, and/or low). A ten point rubric for easy grading is attached.A link to a digital copy of the assignment h
Subjects:
Grades:
8th
Types:
After Testing / End of the Year Cube Project- CCSS 8th Grade Math
This project was used at the end of the year to help my 8th grade math students summarize what they learned this year. It is a great project to use after standardized testing because it gives students a chance to be creative and relax while still adhering to common core standards. Students can work on this project individually or in groups depending on how long you would like to spend on the project. This can even be used as an extra credit assignment. Plus when you are finished with the project
Subjects:
Grades:
6th - 8th
Types:
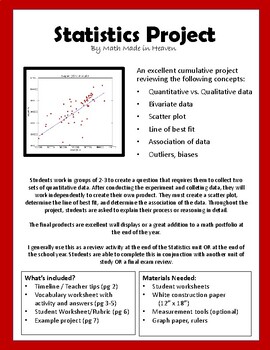
Statistics Project: scatter plot, line of best fit, association of data
An excellent cumulative project reviewing the following concepts: •Quantitative vs. Qualitative data•Bivariate data•Scatter plot•Line of best fit•Association of data (strong, weak, linear, non-linear, positive, and negative)•Outliers, biases, population, sample groupStudents work in small groups to create a question that requires them to collect two sets of quantitative data. After planning and conducting the experiment and collecting data, they will work independently to create their own produc
Subjects:
Grades:
7th - 10th
Types:
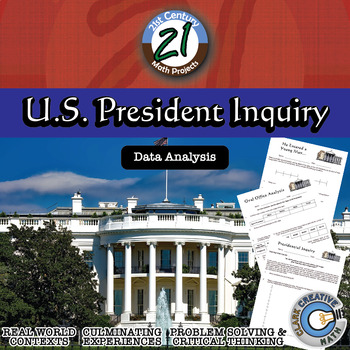
U.S. President -- Data Analysis & Statistics Inquiry - 21st Century Math Project
Engage students in data analysis through use of Presidential data in this 21st Century Math Project. Students will create box and whisker, stem and leaf, histograms and scatterplot through their investigations. In the end, students will take on the inquiry question: "Do US Presidents with the most children live longer after they have been inaugurated?" ***THIS PRODUCT HAS BEEN UPDATED WITH A GOOGLE SLIDES INTERACTIVE VERSION INCLUDED. REDOWNLOAD IF YOU HAVE IT ALREADY***-- In "He Entered a Youn
Subjects:
Grades:
6th - 12th
Types:
Statistics Group Project (8.SP.1, 8.SP.2, 8.SP.3, 8.SP.4)
This group project assesses student knowledge on the following concepts:
-scatter plots
-correlation
-correlation coefficient (using a calculator)
-trend lines and using trend line equations to predict values
-two-way tables
-two-way tables using relative frequency (total, rows, columns)
-identifying trends in two-way tables
-using two-way tables to answer questions
Included:
-Project instruction sheet for students
-Rubric
-Example project to show students (powerpoint)
-handout on using a calcu
Subjects:
Grades:
8th - 9th
Types:
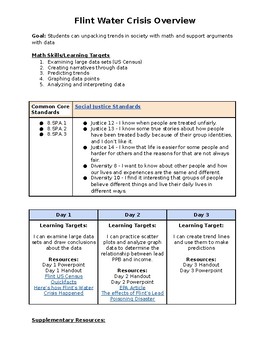
Social Justice Math - Scatter Plots + Trend Lines
I created this resource because I did not find many social justice oriented math resources for 8th grade math, I hope this resource is the basis for critical conversations in your classrooms.
This three day lesson series covers the Flint Water Crisis and the relationship between poverty and lead levels. Students practice examining large data sets (from the US census), the students will plot points on a scatter plot (showing the relationship between poverty and lead levels), students will then d
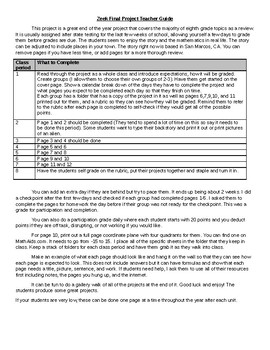
End of the Year Review Project- 8th Grade Math- Zeek the Alien Friend
This project is a great end of the year project that covers the majority of eighth grade topics as a review. It is usually assigned after state testing for the last few weeks of school, allowing yourself a few days to grade them before grades are due. The students seem to enjoy the story and the mathematics in real life. The story can be adjusted to include places in your town. The story right now is based in San Marcos, CA. You can remove pages if you have less time, or add pages for a more tho
Subjects:
Grades:
7th - 9th
Types:
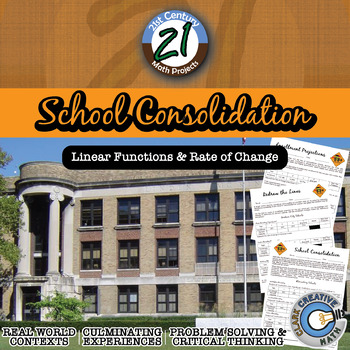
School Consolidation - Linear Rate of Change - 21st Century Math Project
Turn my administrative team meeting into an engaging linear functions 21st Century Math Project! Names and data have been changed to protect the innocent.In this 23 page PDF, you will be given a mapping to the Content Standards, an outline for how to implement the project, 4 different assignments for students to use, and an answer key. ***THIS PRODUCT HAS BEEN UPDATED WITH A GOOGLE SLIDES INTERACTIVE VERSION INCLUDED. REDOWNLOAD IF YOU HAVE IT ALREADY***Download the preview to see pretty much ev
Subjects:
Grades:
5th - 9th
Types:
CCSS:
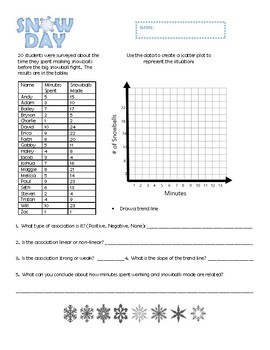
Snow Day / Winter / Holiday Scatter Plot Activity
Make learning scatter plots, trend lines and slope fun with this snow day activity. 8th Grade Data and Statistics activity or small project with answer key.
Subjects:
Grades:
8th - 9th
Types:
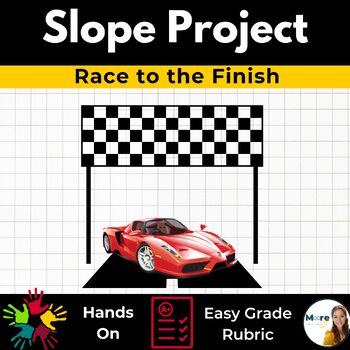
Slope Project - Hands on Linear Equations Project - 8th Grade + Algebra
Race to the finish is NOT your average slope project! Are you ready for a hands on slope project that gets your students up and active? The Race to the Finish linear equations project will have your students ramped up as they work toward their race day expo! Phase 1: Students get hands on designing their ideal ramp and modeling it using graphs of linear equations.Phase 2: Students test and collect data to create a scatter plot and line of best fit to determine the best car to run down their trac
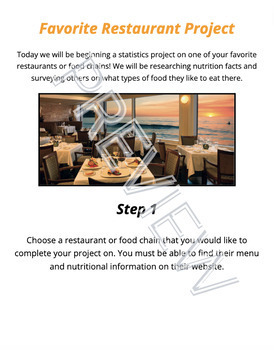
Scatter Plot and Bivariate Data Research Project
Students will begin a statistics project on one of their favorite restaurants or food chains! They will be researching nutrition facts and surveying others on what types of food they like to eat there. Through this data collection they will work on their skills of creating scatter plot graphs, creating relative frequency tables, and analyzing this data. This can be used either by paper or digitally. I used it the last two years during distance learning. Rubric included.
Subjects:
Grades:
7th - 12th
Types:
Showing 1-24 of 86 results

