19 results
Elementary algebra laboratories
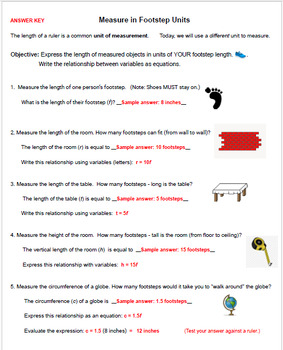
Activity: Measuring in Units of My Foot - Writing Simple Equations
In this activity, students use measuring skills & write one-step equations. An answer key is provided. Students measure the length of their foot (in inches) and use it as a base unit for expressing the length of different objects. Students use the variable "f" and a coefficient (number of footsteps) to write a simple equation for the length of an object. You can add the challenge of having students evaluate the expression. This measuring activity can be used in a math or numeracy class, as w
Subjects:
Grades:
4th - 12th, Higher Education, Adult Education, Staff
Types:
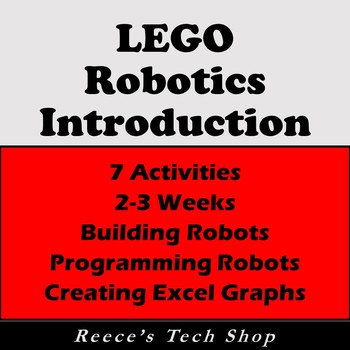
LEGO Robotics Introduction
Here's a 10-15 day set of activities for introducing the LEGO Mindstorms Robots! In this packet, you get:* SEVEN Robot activities!* An EXCEL Activity creating a multiple line graph.* Programming challenges from basic to hard.* Build Guide for "Reece's Runner" Robot* Robot Challenge Design PlansI use this as a 10-day Module in my classroom.
Grades:
5th - 8th
Types:
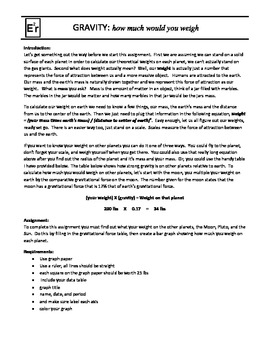
GRAVITY: how much would you weigh
This is a nice little activity for helping your students get to understand how gravity works. In this activity students will be required to calculate how much they weigh on other planets in our solar system. Once they know how much they would weigh, they are required to create a bar graph showing how much they weigh on each planet in graphical form.
This covers common core standard #7, integration of knowledge and ideas.
Subjects:
Grades:
5th - 12th
Types:
How Much for Those Fries? The Math in Action Series.
Ever wonder how the price at a "Fast Food" restaurant may be determined. This activity may just answer that question for you. The application of mathematical theory has always been the "when will I ever use this Real Life" attitude from our students. I created this lesson to reinforce the theory of graphing data, calculating an equation of best fit, and formulating a conclusion. Each student will be able to see the usefulness of mathematics in a Real World setting. Common core stand
Subjects:
Grades:
5th - 11th, Adult Education
Types:
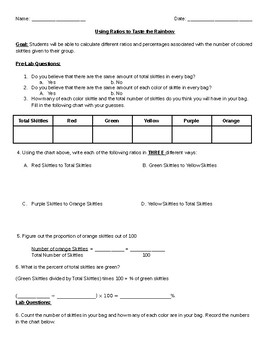
Skittles Proportion Activity
Students are to be provided a bag of skittles. They are going to use proportions and ratios to determine if there are the same number/ratio of each color in all different sized bags.
I had students work in groups of 2 for this activity. Within the activity I broke it up into three different sections; a pre-lab, lab, and post-lab portion. Students make initial guesses/hypothesis, test out their theory, use proportions and ratios to analyze their results and graph data.
Subjects:
Grades:
4th - 9th
Types:

Which Speed for Best Gas Mileage? Math in Action series.
Newly revised and improved. What speed will provide the best gas mileage? This lesson was created to reinforce analyzing and graphing data, identify the independent and dependent variable, calculate the slope of the line passing through the points, project rentals from their analysis, and formulate a conclusion. As an optional activity the student is asked to calculate the equation of the line for the data and compare the result to the one presented in the activity. This activity provides ea
Subjects:
Grades:
5th - 11th
Types:
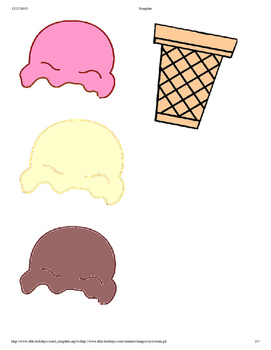
My Own Ice Cream Cone: Slope Activities 1
Introductory lesson to using data to create a linear growth graph and model by building "fake" ice cream cones. Templates are included for the cones and scoops. Instructions for the teacher are also included. Contact me at hrudolph@orangecsd.org for details or clarification. Students will be introduced to appropriate vocabulary such as initial amount, slope, intercept, growth, increasing, model, trend, linear function or linear equation. Lamination is helpful for re-using the materials! A
Subjects:
Grades:
5th - 8th
Types:
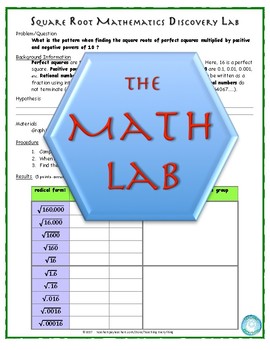
Math Discovery Lab: Square Roots, Multiples of 10, Rational vs Irrational
This is one of a series of self-guided discovery labs for a meaningful understanding of core mathematical concepts. Students use the familiar format of the scientific method to answer a mathematical question/problem. In this lab, students investigate the relationships among square roots, perfect squares, and positive and negative powers of ten (10). This math lab also explores when the square root of numbers such as 0.016, 0.16, 1.6, 16, 160, 1600 are rational or irrational. Full answ
Subjects:
Grades:
4th - 10th
Types:
Math Lab How to Draw a Fibonacci Spiral and DISTANCE LEARNING/NO PREP
I am absolutely excited to share the following Math Lab that teaches students how to draw a Fibonacci Spiral!* This lab is an outstanding way to open any lesson or unit on sequences!* Leonardo Fibonacci is introduced and it is explained to students how the sequence got its name.* Students are given examples of the Fibonacci Sequence as it appears in nature and in architecture.* A list of materials required to complete this lab is provided in the lab.* Students follow well-defined steps to
Grades:
5th - 12th, Higher Education, Adult Education
Types:
Also included in: BUNDLE: Draw the Fibonacci Spiral, Fibonacci in Nature, Golden Ratio
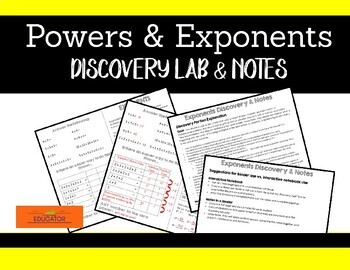
Powers & Exponents Discovery Lab & Notes
Included in this are very detailed instructions on introducing the concept of exponents to students. They will complete a discovery lab guided by you and transition to completing a quick note sheet.works for both interactive notebooks and regular binderscontains detailed instructions on conducting the lab successfully with your students including prompts and suggestions for you to use to help them through the lab.contains a half sheet for the lab portion and half sheet for the notes portion - le
Subjects:
Grades:
5th - 8th
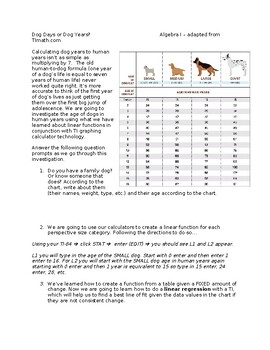
LINEAR REGRESSION - Dog Years vs. Human Years - Calculator Skill & Application
Who doesn't love dogs?!!! In this activity, students will investigate whether the rule of 7 human years = 1 dog year. Students will learn how to do a linear regression using a TI calculator to create the function. I did this lesson AFTER we did linear functions from a table. So when they felt comfortable doing this by hand, I was ready to show them this. We use the LINEAR REGRESSION tool when the change is not the same each time. Students loved this activity and were able to relate to it because
Grades:
5th - 12th
Types:
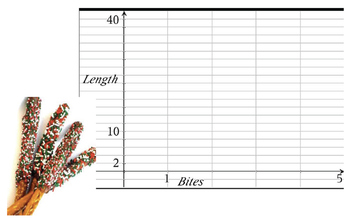
Take a Bite Out of Algebra- Slope Activities 2
Students will literally take a bite out of a pretzel (or Twizzler) and predict the pattern if they would continue to eat it. A decreasing slope is discovered, and a model can be written to portray the situation. Students can predict how many bites it will take for the pretzel (or their fingers!) to be gone. Appropriate vocabulary should be introduced, including slope, intercept, trend, decreasing, and linear.
Subjects:
Grades:
5th - 8th
Types:
MATH LESSON & MATH LAB on Really Big Numbers!
Most people can identify numbers in the millions, billions and trillions, but few people actually know the names for some really big numbers after that! This is a tried and true math lesson and lab that I have created and used for many years with my 7th and 8th grade classes. Students get a "kick" out of learning about really big numbers that they were never able to identify before now. They walk away feeling empowered and ready to share their knowledge with others! In the MATH LESSON, students
Grades:
5th - 10th, Adult Education
Types:
There is No Such Thing as Subtraction
Intended Audience: All grades can use this activity in one form or another! It is a way to scaffold mathematical thinking using manipulatives. It can be used as an introduction to subtraction in the lower grades or an intervention for struggling learners in the later grades. The attached document can be used as a reading exercise for advanced student or its content can be used to help the teacher of the lower grades understand the concept better.Concepts Presented: The document presents th
Subjects:
Grades:
1st - 6th
Types:
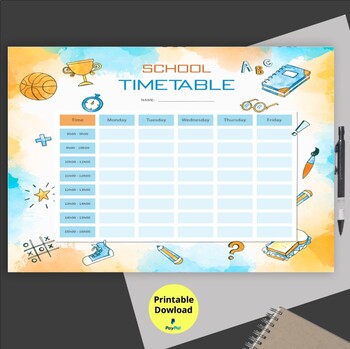
Weekly planner Printable,Weekly printable ,School timetable,Daily Schedule
♥♥ I love designs that makes you feel good. ♥♥ Instant Download - Weekly Schedule Printable, Hourly Planner, Weekly Organizer, Weekly Printable, Daily Schedule, Home school Planner, Family Planner - Letter sizeStay organised and keep track of your weekly school Schedule Planner.This Printable Weekly Schedule Planner includes both Sunday & Monday start days versions.DETAILS: US Letter size (8.5 x 11 inches).• Number of PDF files: 1.• Quality: High quality, 300 dpi.DOWNLOAD INCLUDES:• 1
Subjects:
Grades:
PreK - 12th, Higher Education, Adult Education, Staff
Skittlescopics: An Edible Proportions Lab
This product is an edible lab using bags of Skittles, ratios and proportional reasoning. It includes the lab and directions and an Excel document to use to determine student accuracy. The product is by Mathink.
Subjects:
Grades:
5th - 8th
Types:
How Much for Those Fries?
Newly revised and improved. What price should I charge for an order of french fries to maximize my profit? In this activity, the student will be given a total numbe of french fries orders sold at a given price. From this data the student will be asked to analyze this information and present their findings. This lesson will reinforce the theory of graphing data, defining variables, evaluating equations and inequalities using replacement sets, and formulating a conclusion. The use of spreadsh
Subjects:
Grades:
5th - 10th, Adult Education
Types:
A Slice Of PIE - A Math Experiment
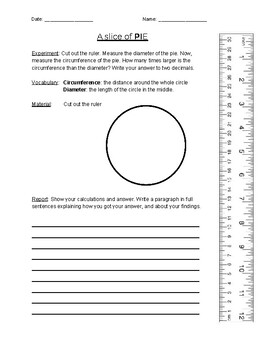
This is an experiment that can be run in the classroom to help familiarize students with the concept of pi through discovery and interactive learning.
Subjects:
Grades:
5th - 8th
Types:
Student Line Grapher
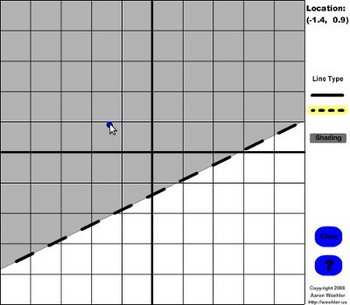
The student line grapher is a simple flash program that can be run locally on your Windows or Mac computer. It allows students to quickly experiment with the information needed to make a line graph or inequality.
Subjects:
Grades:
5th - 11th
Types:
Showing 1-19 of 19 results


