5 results
Common Core 8.SP.A.3 laboratories
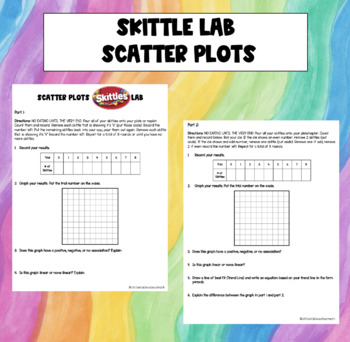
Skittles Lab - Scatter Plots
In this lab, students will be creating data that they can use to create scatter plots and either demonstrate their understanding of scatter plots or discover new learning about scatterplots. Students will be creating two different scatter plots based on their skittles in their cup. They will follow directions and plot the data they create. The first part has students analyzing the trend of their data (positive, negative, no association) and describing the shape of the data. The second part of t
Subjects:
Grades:
7th - 9th
Types:
Drop Zone: Parachute Design Project-Based Learning Lab
This highly adaptable investigation will engage students of many ages and levels. Options for primary, upper elementary, and middle school are included. This is a true STEM lab that incorporates the science, technology engineering, and math components. Common, inexpensive, and easily available materials make this an easy lab to teach yet it produces maximum learning and engagement in your classroom. NGSS and Common Core Math Standards alignment are included in this "STEM on a Shoestring Budget"
Subjects:
Grades:
1st - 8th
Types:
People Perfectly in Proportion: The Golden Ratio
Zip File includes - PDF and editable documentLesson Setup: This lesson can be used for students at all developmental levels. Measuring with a ruler, error analysis, and proportional thinking are a few of the skills this lesson practices. Groups can be made based upon skill requirements. Lower functioning students can perform measurements and watch higher performing students do calculations. Result could also be presented by a possible third student - if you want to do trios as opposed to pa
Subjects:
Grades:
3rd - 12th, Adult Education
Types:
X vs Y: A Variable Recording and Graphing Lab
A 3 day to week long laboratory exploration into independent and dependent variables, and how equations like y=mx+b can describe the relationships between them.After breaking down the lab's instructions, students will get to choose their own x and y variables and then come up with a procedure for gathering data. Depending on how outgoing/creative they are, collecting the data for this lab can be a blast! Once they have 20 (x,y) samples, they will graph them and draw a line that fits the data. Th
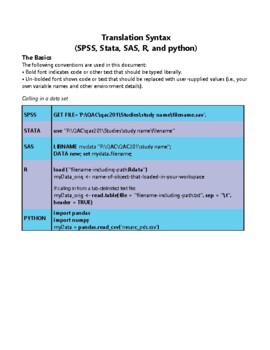
STATA software Secondary Data Analysis
This handout is intended for those interested in teaching/learning basic introductory statistics concepts to analyze real data. Students will learn how to tell a story using secondary data analysis. The handout is for STATA software and the US Longitudinal Study of Adolescent Health data set. For handouts on setting up an account, the data set code book and raw data file, a PowerPoint to accompany the handout, or questions please email kristin.flaming@gmail.com or ldierker@wesleyan.edu.This
Grades:
6th - 12th, Higher Education, Adult Education
Types:
Showing 1-5 of 5 results

