6 results
Common Core 5.G.A.1 laboratories
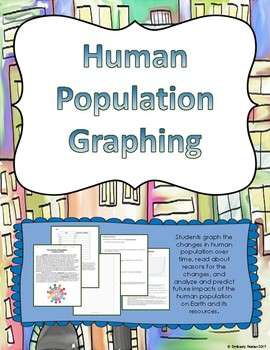
Human Population Graphing Activity
Students graph the human population over time. Included is a short reading about reasons the human population has increased (written for students below 6th grade reading level to comprehend) as well as analysis or discussion questions for after the graph is created.This activity is meant to help students understand that the human population is rapidly growing that that this has an effect on our resources, as well as practice in graphing and graph interpretation and analysis. This addresses the f
Subjects:
Grades:
5th - 8th
Types:
CCSS:
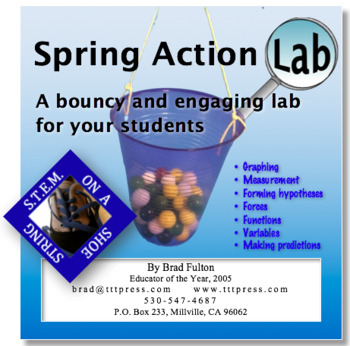
Spring Action Lab: A Bouncy and Engaging STEM Lab
Students will enjoy putting their learning to work in this engaging lab. Using springs or rubber bands, students measure and record data as they try to get a bucket to touch the floor by adding weights. Then they use their data and its graph to make predictions and write equations that will help them predict the outcomes. This simple and inexpensive lab will help your students learn graphing, t-tables, measurement, linear functions, and the physics of tension forces. This can be used as a stand-
Subjects:
Grades:
5th - 9th
Types:
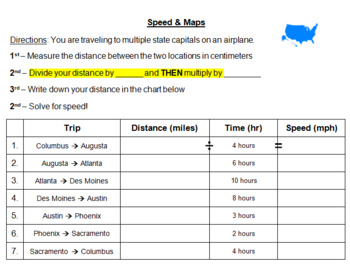
Finding Speed with Maps - OHIO 5TH GRADE SCIENCE
Use any map you want! Students pretend they are flying on a plane to different state capitals. They will measure the distance in cm and then convert to miles based on YOUR map's scale. Students solve for speed & rank each trip based on how fast the plane was moving. Students create a bar graph to show their results!
Subjects:
Grades:
3rd - 8th
Types:

Scientific method, inquiry outline, lab, with a teacher example.
This contains a scientific method, or scientific inquiry, outline of the steps. It includes: question, hypothesis, create/perform/record the experiment in a table, analyze and make a conclusion for the experiment using a graph, communicating results, an example of a graph, an example of a table, dependent variables, independent variables. It provides students with the steps, which they can fill in during a lab at school, or a lab students create. This includes an example of the outline for a lab
Grades:
2nd - 9th
Types:
NGSS:
5-ESS2-2
, MS-ESS2-3
, MS-ESS2-2
, MS-ESS2-1
, MS-ESS2-4
...
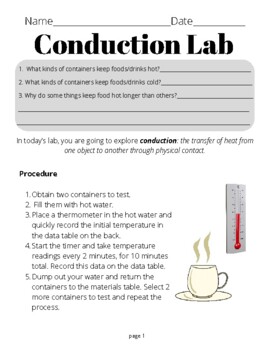
Heat Conduction Lab, Graphing activity, Elementary and Middle
This is a lab activity exploring heat conduction using various containers and hot water. Students gain experience recording data, and graphing their results with a line graph, then drawing conclusions about how well different materials conduct heat. A teacher's guide is included explaining approximately how long the lab takes and walks you through how to conduct the lab and graphing exercise. An optional lab report assignment is included along with a rubric.
Subjects:
Grades:
2nd - 7th
Types:
NGSS:
4-PS3-2
, MS-PS1-6
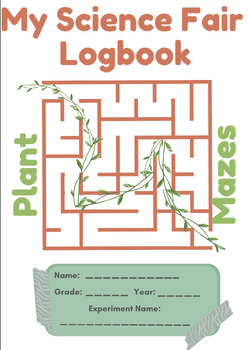
Plant Mazes - Science Fair Logbook
Looking to do a science experiment, but don't want your whole class to have to do the same thing, or don't have the time to make a logbook? Look no further.Introducing the Plant Maze logbook, a graphic organizer that includes all aspects needed for a fantastic science fair project. This logbook includes identifying variables and materials, observations written and drawn, a graph to measure growth, conclusion and much more!This logbook is created for a Plant Maze experiment. Students and teachers
Subjects:
Grades:
3rd - 6th
Types:
Showing 1-6 of 6 results

