122 results
8th grade basic principles interactive whiteboards
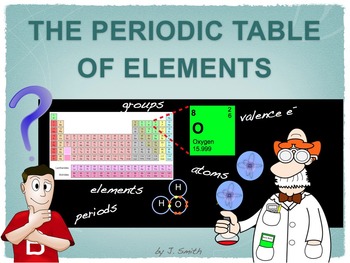
The Periodic Table of Elements - PowerPoint Format
This “Periodic Table of Elements” is a PowerPoint presentation, containing 58 slides. (Please Note: There is also a PDF format available, the PDF format contains exactly the same information as shown in this PowerPoint presentation.)
If you would like to have an extensive preview of this product, there is a free PDF available, entitled "The Period Table of Elements - Free Sample". It contains the first 26 slides of this presentation.
This Period Table of Elements presentation reviews and disc
Subjects:
Grades:
5th - 10th
Analyzing Data & Interpreting Graphs Digital Task Cards for BOOM Learning BUNDLE
Great for both digital and traditional learning, this bundle contains three decks of twenty-five cards and one deck of nine cards for a total of 84 cards about data analysis and graph interpretation. Line graphs, bar graphs, and pie charts are all included. The question types include typing the correct response, answering True or False, and clicking the correct response.The Boom Decks included in this bundle are listed below:Analyzing Data and Interpreting Graphs Volume 1Analyzing Data and Inter
Subjects:
Grades:
5th - 8th
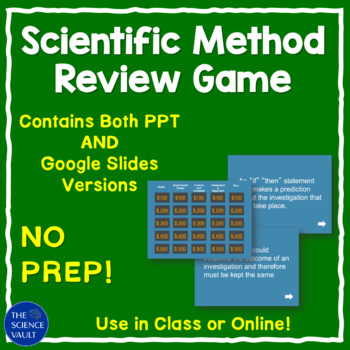
Scientific Method Jeopardy Style Review Game
Engage Your Science Students with this Jeopardy-Style Experimental Design Game! Dive into essential topics like science vocabulary, variables, control groups, constants, and data graphing with this interactive game that my students absolutely love! It includes both PPT & Google Slides versions, making it perfect for any classroom setting.Why My Game Stands Out:Versatile Use: Ideal for assessing students' knowledge at the beginning of the year, re-energizing the last 15 minutes of class, and
Subjects:
Grades:
6th - 8th
Also included in: Scientific Method and Metric System Bundle + Ice Breakers
Variables Digital Task Cards for the Scientific Method on BOOM Learning
These 26 digital task cards on the BOOM Learning website cover independent variables, dependent variables, and controlled variables in the scientific method. Students practice the definitions of each variable and practice identifying the variables in various hypotheses and scientific questions. These digital task cards work on laptops, desktops, Smart Boards, Chromebooks, tablets, and any other mobile devices that can access the Internet. They are self-grading and allow you to track student prog
Subjects:
Grades:
5th - 8th
Also included in: Scientific Method HUGE Bundle: All of My Scientific Method Resources

Hallowe'en Science Experiments/Activities
Four exciting, hands-on and engaging Hallowe'en Science experiments you can do with your class using simple and easy to find supplies. In the older grades you can even explain the Science behind the chemical and state reactions! This file also links to two videos on YouTube demonstrating the experiment.
Subjects:
Grades:
PreK - 8th

Balanced, Unbalanced and Net Forces
This 20 slide presentation examines the basic relationship between forces in a way that is easy for students to understand. Topics include net force, unbalanced force and balanced forces. This presentation was designed for the middle school classroom.
Within this presentation is a built in class discussion. Vivid animations are included to capture your students attention and to spark a greater understanding about each type of force.
Subjects:
Grades:
4th - 10th
Hypothesis Digital Task Cards for the Scientific Method on BOOM Learning
These 24 digital task cards on the BOOM Learning website cover hypotheses in the scientific method. Students practice the definition of hypothesis and using the If/then format. These digital task cards work on laptops, desktops, Smart Boards, Chromebooks, tablets, and any other mobile devices that can access the Internet. They are self-grading and allow you to track student progress. No printing is needed. This resource includes a link to access the Boom Deck of 24 digital task cards on the Boom
Subjects:
Grades:
5th - 8th
Also included in: Scientific Method HUGE Bundle: All of My Scientific Method Resources
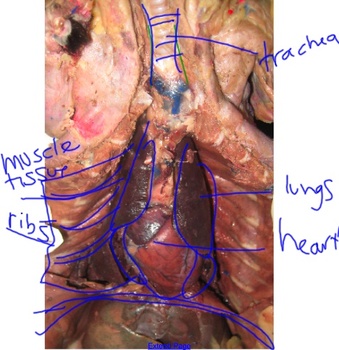
Mink Dissection
This is the presentation I created to help my students through each major step of a mink dissection.
While the presentation came in handy, I also modeled each step for them, but tried not to show them TOO much as I went-- there's something great in the discovery being theirs.
As they started opening each mink, I would call them back, show more pictures on the board, or model through mine a bit more, quizzing as I went.
(The first day is the toughest as students have to find the trachea and e
Subjects:
Grades:
6th - 9th
Types:
Variables and Hypotheses Scientific Method Digital Task Cards BOOM BUNDLE
Perfect for your scientific method unit, this bundle of digital task cards for middle school science contains three decks of twelve cards each. The decks focus on identifying independent variables, dependent variables, and controlled variables as well as making good hypotheses in the If/then format. Target your students' needs by adding these decks to your scientific method unit as a practice, a review, or an assessment. All of the cards in all three decks are centered around the same sports and
Subjects:
Grades:
5th - 8th
Analyzing Data: Making Good Graphs Digital Task Cards on BOOM Learning
These 25 digital task cards on the BOOM Learning website are about data analysis in the scientific method. The cards cover the following graphing concepts: what makes a good graph (including titles, axis labels, intervals, and more)the location of the x-axis and y-axiswhere independent and dependent variables go on a graph (think DRY MIX)the purpose of a line graph and how to graph themthe purpose of a bar graph and how to graph themthe purpose of a pie chart and how to graph themThere are three
Subjects:
Grades:
5th - 8th
Also included in: Analyzing Data BUNDLE: A Scientific Method Resource
Scientific Method Digital Task Cards on BOOM Learning BUNDLE
Great for virtual and in-person learning, this bundle contains six Boom Decks of digital task cards about the scientific method. Topics included are variables, the steps of the scientific method, qualitative and quantitative observations, hypotheses, scientific questions, and making good graphs.The six Boom Decks included in this bundle are listed below:Steps of the Scientific MethodHypothesesIndependent Variables, Dependent Variables, and ConstantsQualitative and Quantitative ObservationsScient
Subjects:
Grades:
5th - 8th
Analyzing Data and Interpreting Graphs Digital Task Cards for BOOM Learning V1
A great distance learning option, these 25 digital task cards are about data analysis and interpreting line graphs, bar graphs, and pie charts. There are five graphs, each with five different questions. The five questions per graph gradually increase in difficulty. The question types include typing the correct response, answering True or False, and clicking the correct response. These digital task cards work on laptops, desktops, Smart Boards, Chromebooks, tablets, and any other mobile devices
Subjects:
Grades:
5th - 8th
FREE Analyzing Data & Interpreting Graphs Digital Task Cards for BOOM Learning
A great option for distance learning, these nine digital task cards are about data analysis and graph interpretation of line graphs, bar graphs, and pie charts. There are three graphs, each with three different questions. The three questions per graph gradually increase in difficulty. The question types include typing the correct response, answering True or False, and clicking the correct responses.These digital task cards work on laptops, desktops, Smart Boards, Chromebooks, tablets, and any ot
Subjects:
Grades:
5th - 8th

Plants for Food and Fiber Unit Bundle #2
This bundle contains lesson material needed to teach the Plants for Food and Fiber. The unit is designed to meet Alberta Education requirements in Grade 7 science, but can be used and modified to fit your own needs!Lessons in this bundle include:- Growing Conditions- Types of Soil- Soil Practices- Modifying Yields and Selective Breeding- PestsThis bundle contains:- Powerpoint presentations- Teacher lesson plans- Student notebook- Soil exploration investigation stationsPlease make sure that you
Subjects:
Grades:
6th - 8th
Also included in: Science 7 Course Bundle
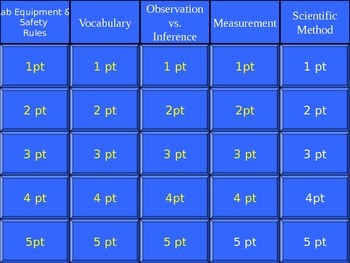
Scientific Inquiry Jeopardy
This jeopardy game reviews the following topics: laboratory safety equipment and rules, measurement, observation vs. inference, scientific method, and related key terms. A study guide has been included as the preview that corresponds with the game. Each question slide of the game contain a number that aligns with the same question number on the study guide. Therefore, at the end of the game, each student will have completed their own study guide.
Subjects:
Grades:
4th - 10th
Steps of the Scientific Method Digital Task Cards on Boom Learning
These 26 digital task cards on the BOOM Learning website cover the six steps of the scientific method. The students practice the correct order of the steps of the scientific method and identify what each step looks like in an experiment.The six steps of the scientific method in this Boom Deck are as follows:Make an observation and ask a question about itResearch if neededMake a hypothesisTest the hypothesis in an experimentRecord and analyze the dataWrite a conclusion to share the resultsThere a
Subjects:
Grades:
5th - 8th
Also included in: Scientific Method HUGE Bundle: All of My Scientific Method Resources
Independent, Dependent, & Controlled Variables Practice Digital Task Cards BOOM
In this Boom Deck of twelve digital task cards your students will read a hypothesis and then classify variables. Each card has one independent variable, one dependent variable, and two controlled variables (constants). All cards in the deck are in the same format where students classify variables by clicking and dragging them into a chart. The hypotheses are centered around sports or physical activities.These digital task cards work on laptops, desktops, Smart Boards, Chromebooks, tablets, and a
Subjects:
Grades:
5th - 8th
Also included in: Scientific Method HUGE Bundle: All of My Scientific Method Resources
Qualitative and Quantitative Observations Digital Task Cards on BOOM Learning
These 30 digital task cards on the BOOM Learning website cover qualitative observations and quantitative observations in the scientific method. Students practice the definition of each type of observation and classify observations as either qualitative or quantitative. These digital task cards work on laptops, desktops, Smart Boards, Chromebooks, tablets, and any other mobile devices that can access the Internet. They are self-grading and allow you to track student progress. No printing is neede
Subjects:
Grades:
5th - 8th
Also included in: Qualitative and Quantitative Observations Bundled Science Package
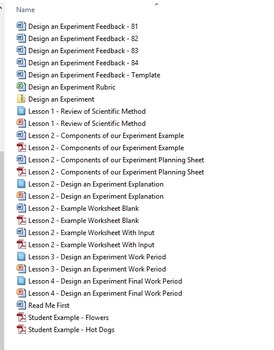
Scientific Method - Design Your Own Experiment Worksheet
The package contains editable files for four lessons. The first lesson is a review of the scientific method. I use a Mythbusters video (not included because of copyright) to guide students through the features of the scientific method. Then, in the second lesson, I introduce the assignment to the students - they will become the teacher and create a worksheet for an experiment of their choosing (real or fictional). They use their knowledge of the scientific method to plan out their worksheet.
Subjects:
Grades:
7th - 10th
Analyzing Data and Interpreting Graphs Digital Task Cards for BOOM Learning V2
A great distance learning option, these 25 digital task cards are about data analysis and graph interpretation of line graphs, bar graphs, and pie charts. There are five graphs: two bar graphs, two line graphs, and one pie chart. Each of the five graphs has five different questions. The five questions per graph gradually increase in difficulty. The question types include typing the correct response, answering True or False, and clicking the correct response. These digital task cards work on lapt
Subjects:
Grades:
5th - 8th
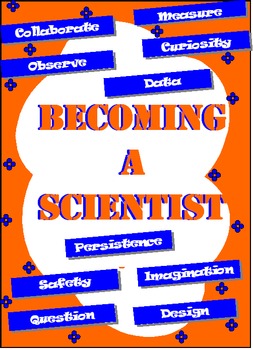
Becoming a Scientist Unit Plan
This is the first unit that I use in my sixth-grade science class. It covers classroom expectations, lab safety rules and symbols, the metric system, and includes an experiment where student compare and test their unique designs. My students use a lab notebook, so pages are meant to be cut and glued into the notebook. However, the pages can be easily completed on their own without the notebook.
This unit also includes references to the New Generation Science Standards (public draft from June 20
Subjects:
Grades:
4th - 8th
Science Variables and Airplanes
This is a lesson that was created to teach students about science variables: independent, dependent, control, and constants. Individual students create a paper airplane then improve upon one plane the group chooses. Included with this purchase is a WORD document that can printed and used with students. Also is a smartboard presentation to use with the lesson. In the presentation is also a slide with student lab roles and the description of those rules. Mean, median, mode and range is also c
Subjects:
Grades:
4th - 8th
Types:
Pencil Whiteboard Flip Calendar
Whiteboard Flip Calendar in shape/design of a pencil.
Subjects:
Grades:
PreK - 12th
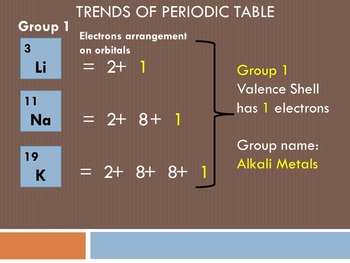
Chemistry Unit - Trends of the Periodic Table of Elements
A visually rich powerpoint covering:
- trends seen in the Periodic Table of Elements (step-by-step animations help student understand the importance of valence electrons in classifying the elements)
- characteristics of each main group/family.(ie. alkali metals, alkaline earth metals, halogens and noble gases)
- links to relevant educational videos (internet connection required) to reinforce newly learned concepts
A great introduction to chemistry for grade 9 or 10 level. The powerpoint fo
Subjects:
Grades:
8th - 10th
Showing 1-24 of 122 results


