74 results
8th grade statistics videos

Two-Way Tables and Probability Lesson
This is a whole lesson looking at the different aspects of Two-Way Tables. This is a way of displaying data and questions are often more varied than some students may think. The lesson covers three main types of questions 1) Filling in missing data 2) Reading data from a two-way table 3) Taking figures out of a worded context and putting it into a two-way table in order to solve a probability. This lesson is ready to go, with no prep required. It is also great for home learning and flip learnin
Subjects:
Grades:
6th - 10th
Also included in: Statistics ALL LESSONS
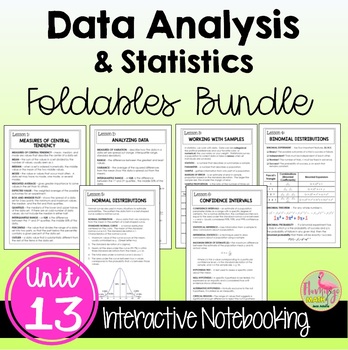
Data Analysis and Statistics FOLDABLES™ (Algebra 2 - Unit 13)
This bundle of 8-page Bound-Book-Style Foldables includes six lessons on topics in UNIT 13: Data Analysis & Statistics for your Algebra 2 Honors students. A set of finished notes and directions for creating the Foldables are also included.⭐ Bonus: A set of Google Slides for presenting the lesson and video lesson links are now included for distance learning and flipped classroom methods.☆FOLDABLESThree options of an 8-page Bound-Book Foldable® will help with differentiation.Option #1: All voc
Subjects:
Grades:
8th - 11th, Higher Education
CCSS:
Also included in: Algebra 2 Curriculum Big Bundle | Flamingo Math
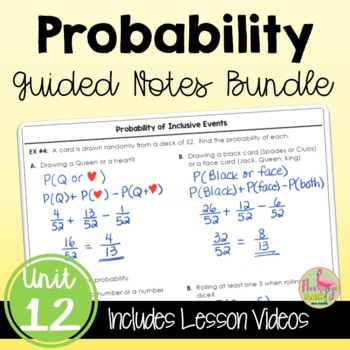
Probability Guided Notes (Algebra 2 - Unit 12)
Your Algebra 2 Honors students will have a set of Guided Student Notes plus Google Slides and a Warm-Up exercise with Video Lessons for each section to meet your flipped classroom or distance learning needs. There is also a complete solution set for lessons covering the topics and concepts for Probability. Teachers also have a fully-editable pacing guide with topics and standards for your planning needs.Guided Notes Format:The unit includes five lessons that will take approximately 15 instructio
Subjects:
Grades:
8th - 11th, Higher Education
Types:
CCSS:
Also included in: Algebra 2 Curriculum Big Bundle | Flamingo Math
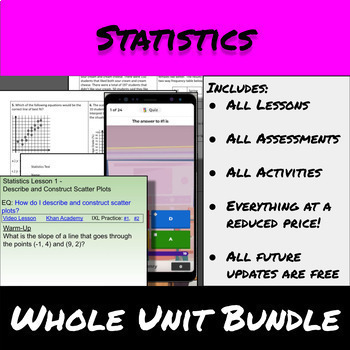
Statistics-Whole Unit Bundle
This bundle includes EVERYTHING needed to teach the unit on Statistics with scatter plots and two-way frequency tables for 8th grade students.Included are:all lessons(with video lesson, homework, and worked out solutions)all worksheets free and paidall activitiesall assessmentsYou get all unit resources at 20% off. Purchase now and you also get any future updates and new resources free without having to purchase them as all new resources will be added to the bundle.Free Updates:12/1/2023: Added
Subjects:
Grades:
7th - 10th
Types:
Scatterplots, Linear Regression, Correlation vs. Causation (Video) (Common Core)
UPDATE: Now includes Google Slides lecture and worksheet with editable features!Lesson and video to enable distance learning:Relationships between Two Quantitative Variables: Linear Regression Models, and Correlation vs. Causation (Common Core Aligned Lesson) This product includes a lesson plan and video lecture with worksheet and answer key aligned with the common core. Students review how represent the relationship between two quantitative variables on a scatterplot. Students learn how to fit
Subjects:
Grades:
8th - 12th
Types:
CCSS:
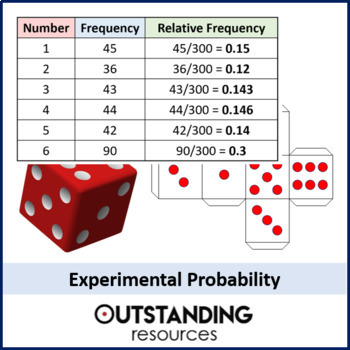
Experimental Probability (Relative Frequency) Lesson
This is a whole lesson on Relative Frequency or Experimental Probability. This is a really fun lesson that involves figuring out which are the best properties to own in Monopoly as well as making bias dice. There is enough material here for some groups to be two lessons. This lesson is ready to go and is superb for home or distance learning. Great for flipped learning. 17-slide presentation + ORIGINAL VIDEO CONTENT + lots of supplementary resources. The lesson comes with:+ a Starter+ Learning O
Subjects:
Grades:
5th - 9th
Also included in: Probability BUNDLE

Introduction to Venn Diagrams and Sets
This is a whole lesson on Introducing Venn Diagrams and Sets. It looks at what Venn Diagrams and Sets are, and how to put data into a set and some basic questions. It comes with an excellent worksheet. This lesson is ready to go, with no prep required. This lesson is also great for home learning and flip learning. 19-slide presentation + supplementary resources.This lesson comes with:+ Starter+ Learning objectives (differentiated)+ Keywords+ key notation+ Superb teaching slides (with custom anim
Subjects:
Grades:
7th - 10th
Also included in: Venn Diagrams and Sets Bundle
Shapes of Distributions (Video): Statistics for Center & Spread (Common Core)
UPDATE: Now includes Google Slides lecture and editable worksheet!Lesson and Video to Enable Distance Learning:Statistics: How the Shape of the Distribution Determines Choice of Statistics for Center and SpreadThis product includes a lesson plan and video lecture with worksheet and answer key aligned with the common core. Students learn how to identify and interpret the shape of a data distribution. Students also learn how the shape of the distribution and the presence of outliers affect the cen
Subjects:
Grades:
8th - 12th
Types:
CCSS:
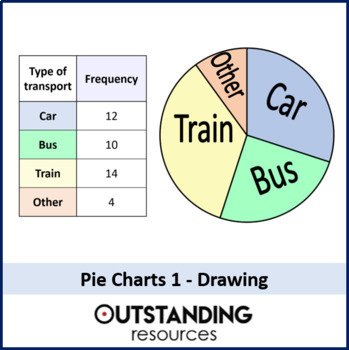
Drawing Pie Charts Lesson
This is the first of two fantastic lessons on Drawing Pie Charts. The first is on calculating and drawing pie charts and the second is on interpreting and being able to working backwards. This lesson is ready to go, with no prep required. It is also great for home learning or flip learning. 23-slide presentation + ORIGINAL VIDEO CONTENT + lots of supplementary resources.The lesson includes: + Starter (links into why do we draw pie charts)+ Learning Objectives+ Excellent teaching slides on why we
Subjects:
Grades:
6th - 10th
Also included in: Statistics ALL LESSONS
18:36
Box and Whisker Plots Video Lesson with Student Notes
This video lesson teaches students how to represent data with a box and whisker plotIn particular, students will learn... * How to identify the quartiles of a set of data * To identify the interquartile and outliers * How to make a box-and-whisker plot given a set of data You receive not only the instructional video but accompanying notes for students to complete as they watch the lesson. Answer key is also included. Upon purchase, you will receive the student notes as well as the ability to str
Subjects:
Grades:
6th - 8th
Types:
Bearings Bundle
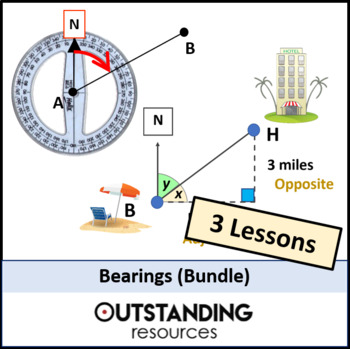
This is an excellent 3 LESSONS bundle on Bearings. Looking at all different aspects and problems involving bearings and questions involving trigonometry. These lessons are ready to go, with no prep required. They are also great for home learning and flip learning, with ORIGINAL VIDEO CONTENT. The lessons are as follows:Lesson 1 - Bearings and MeasuringLesson 2 - Bearings with Trigonometry (SOHCAHTOA)Lesson 3 - Bearings with Trig (Cosine and Sine Rules)ALSO:1. Please provide a RATING with feedbac
Subjects:
Grades:
8th - 11th
Intro to Probability, 8 Assignments, 6 Intros on YouTube
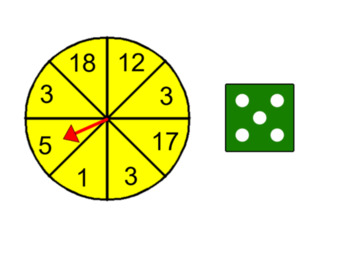
Included in this zip folder are 22 PDF files.8 files are assignments with full solutions.8 files are assignments with odd solutions and a YouTube link to an explanation of odd solutions.6 files are Introductory files with an accompanying YouTube video.Intro #1 is over the Fundamental Counting PrincipleIntro #2 is over "and" vs "or"Intro #3 is over 1 event probabilityIntro #4 is over the complement of an eventIntro #5 is over Independent and Dependent eventsIntro #6 is over Theoretical and Experi
Subjects:
Grades:
7th - 10th
Types:

Venn Diagrams, Set Notation and Two Set Problems
This is a whole lesson on Venn Diagrams, Notation, and Two Set Problems. It looks at what sets are and how to shade a region given a description. The lesson also looks at writing a description given a shaded set. It comes with an excellent worksheet looking at 2 set problems. This lesson is ready to go and requires no prep. This lesson is also great for home learning and flip learning. 18-slide presentation + ORIGINAL VIDEO CONTENT + supplementary resources.This lesson comes with:+ starter (to g
Subjects:
Grades:
8th - 11th
Also included in: Venn Diagrams and Sets Bundle

Video Bundle: Measures of Central Tendency
This collection of video tutorials covers measures of central tendency. Separate videos on mean, median, and mode, as well as statistical analyses are included.
Subjects:
Grades:
6th - 10th
22:05
Compound Events Video Lesson with Student Notes
This probability & statistics video lesson teaches students how to find the probability of compound events (independent events and dependent events).In particular, your students will learn... * The difference between independent and dependent events * How to find the probability that two independent events will both occur * How to find the probability that two dependent events will both occur * That mutually exclusive events are events that cannot occur at the same time You receive not only
Subjects:
Grades:
7th - 8th
Types:
Middle School Statistics and Probability Video BUNDLE
Served to you on a silver platter is this BUNDLE of Middle School Statistics and Probability Videos!Always served on Mrs. Butler’s Silver Platter: ✓content is broken down ✓content is repeated ✓easy-to-work-with numbers ✓suitable for pre-teaching, review & remediation ✓used by special education teachers & parents “Supporting Document” for videos is currently my Terms of Use and my Many Thanks to you! ♥ Remember that #BundlesAreBest! This BUNDLE is offered to save YOU money! *cha chi
Intro to Statistical Graphs Mystery | The Mystery Classroom
**WATCH THE PREVIEW VIDEO. FROM THE CREATORS OF THE ESCAPE CLASSROOM COMES THE MYSTERY CLASSROOM. WE HAVE JUST REDEFINED EDUCATION AGAIN WITH THIS NEW AND INNOVATIVE PRODUCT.**INCLUDES:1) Mystery Activity (internet connection required)2) Handout Material3) Lesson Plan On Subject4) PowerPoint Presentation5) Interactive Videos6) Count Downs *Your students will have to figure out “who did it”. Students will engage with specific content in order to unlock multiple clues until they reach the testimon
Subjects:
Grades:
4th - 9th
Types:
13:10
Mean, Median, Mode, and Range Video Lesson
This video lesson teaches students how to find the mean, median, mode, and range from a set of data.In particular, your students will learn... * The following terms and concepts: statistics, data, population, parameter, sample * The 4 types of sampling (random, systematic, convenience, and cluster) * How to find the mean of a set of data * How to find the mode of a set of data * How to find the median of a data set * How to find the range of a data setYou receive not only the instructional video
Subjects:
Grades:
6th - 8th
Types:
20:48
Interpreting Graphs Video Lesson with Student Notes
This video lesson teaches students how to interpret bar graphs, line graphs, histograms, and circle graphs.In particular, your students will learn... * That a bar graph is used to show a comparison of amounts in specific categories * How to read data from a bar graph * That a line graph is used to show changes in value of the data * How to interpret data from a broken line graph * That a histogram is a type of bar graph used to display frequency distribution * How to read data and find the mean,
Subjects:
Grades:
6th - 8th
Types:

Video: Measures of Central Tendency: The Mean and Normally Distributed Data
In this video tutorial students learn about normally distributed data and how to identify the population mean from the normal distribution. Standard deviation is briefly introduced. Includes three real-world examples.
Subjects:
Grades:
6th - 10th
CCSS:
Also included in: Video Bundle: Measures of Central Tendency
Making Inferences & Predictions w/ Random Samples Virtual Editable NOTES & VIDEO
Editable Notes Page in PDF & World FormatUsing classroom data to make inferences with dot plots & box plots. Making predictions with proportions.Click here --> Making Inferences VIDEOYou may also like:Comparing Populations Video & Notes
Subjects:
Grades:
6th - 8th
Types:
Look at your Data! Video Lesson: Dot Plots (Common Core Aligned)
UPDATE: Now includes Google Slides lecture and worksheet with editable features!Lesson and Video to Enable Distance Learning:Statistics: Create, Interpret, and Compare Dot Plots: This product includes a lesson plan and video lecture with worksheet and answer key aligned with the common core. Review how to create and interpret dot plots from raw data. Students also learn how to compare populations using side-by-side dot plots and summarize their conclusions. The worksheet can be used as an in-cla
Subjects:
Grades:
8th - 12th
Types:
CCSS:

Probability Complementary Events Lesson Video
7th Grade Probability Unit - Complementary Events (Complete Lesson Video)
This video is designed to be used with a class discussion element to fully develop the concept and implementation of Complementary Events. This video goes through the basic definition, how to name a complementary event, and find the probability of a complementary event.
This video can be used as a stand alone lesson or with the notebook file and homework "Probability: Complementary Events Lesson".
Subjects:
Grades:
6th - 8th
Types:
CCSS:
Statistics Video Lesson: Boxplots from Five-Number Summaries (Common Core)
UPDATE: Now includes Google Slides lecture and worksheet with editable and interactive drag-and-drop features!Lesson and Video to Enable Distance Learning: Statistics: Create, Interpret, and Compare Boxplots from Five-Number Summaries This product includes a lesson plan and video lecture with worksheet and answer key aligned with the common core. Review how to create and interpret boxplots from raw data, including how to compute the five-number summary (minimum, Q1, median, Q3, maximum) and how
Subjects:
Grades:
8th - 12th
Types:
CCSS:
Showing 1-24 of 74 results


