8 results
Graphing Common Core HSN-Q.A.3 resources
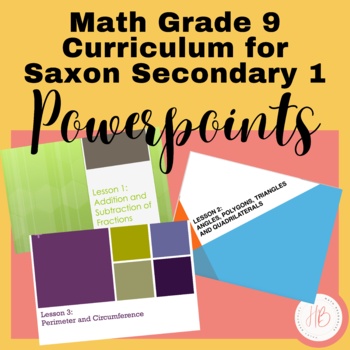
9th Grade Saxon Secondary 1 Math Powerpoints
These 120 Powerpoint lessons work hand in hand with the Saxon Algebra 1 math textbook. If you do not teach the Saxon program then these Powerpoints can be used to help teach the Secondary 1 Common Core. Each Powerpoint consists of a lesson overview which includes formulas and direct instructions. After that there are several practice problems that allows students to put into practice what they just learned. This is a great opportunity for group work as well as for the teacher to walk around the
Grades:
8th - 9th
Types:
CCSS:
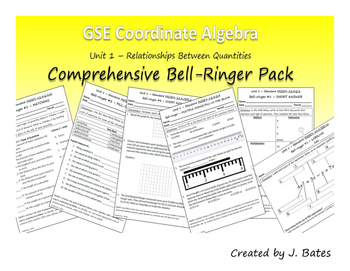
Coordinate Algebra Unit 1 Bell-Ringer Pack (Relationships Between Quantities)
This pack contains a set of 22 bell-ringer tasks aligned to each of the standards for Unit 1 of Coordinate Algebra - Relationships Between Quantities. They are designed to serve as short opening activities for your classes, as well as to be quick and easy to grade.
To conserve paper, each of the 22 pages contains two copies of the same task and a cut line so you only use half a sheet of paper per task per student.
Each bell-ringer task is headed with the standard number it is aligned to as we
Subjects:
Grades:
8th - 10th
Types:
CCSS:

MEAN, MEDIAN,MODE, STEM AND LEAF, and BOX AND WHISKER
MEAN, MEDIAN,MODE, STEM AND LEAF, and BOX AND WHISKERAlso, Graphing Inequalities. No graphs included
Grades:
8th - 9th
Types:
CCSS:
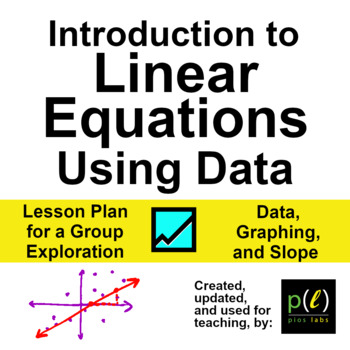
Introduction to Linear Equations Using Data: Lesson Plan for a Group Activity
LESSON PURPOSE:This lesson plan introduces linear equations by having a group of students model real, quickly-gathered class data. The goal is to help motivate student interest in data collection, graphing, linear equations, and slope, while minimizing the time normally needed to collect data in other contexts.This is a .zip file including an editable PowerPoint of the lesson, a PDF of the slides that can be distributed or uploaded, a PDF of the teacher notes that the instructor can refer to as
Grades:
8th - 12th, Higher Education, Adult Education
CCSS:
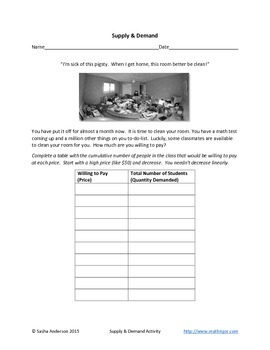
Supply and demand
A classroom activity where student build their own demand and supply curves based on what they are willing to pay (or be paid) for a clean room. Students must reason quantitatively and use units common in economics to solve problems in market equilibrium. Algebra- linear equations, systems of equations, and functions.
Subjects:
Grades:
9th - 12th, Higher Education, Adult Education
Types:
CCSS:
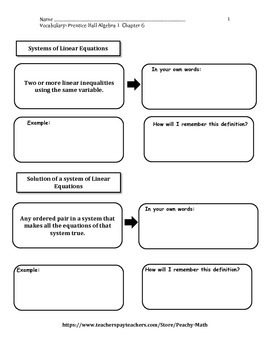
Pearson Algebra 1 Vocabulary Chapter 6
Use this to help your students learn, understand and remember key vocabulary from Chapter 6. Definitions are already given. Student rewrite the definition in their own words, give examples and then determine how they are going to remember these words.
Grades:
5th - 9th
Types:
CCSS:
Math Lesson | Precipitation Graphing Activity | Gr. 9-12
In this lesson, students use New Jersey precipitation data to create graphs and discuss climate change.Step 1 - Inquire: Students discuss initial observations about a New Jersey precipitation data chart showing monthly and annual averages.Step 2 - Investigate: Students explain the relationship of precipitation over time by graphing, finding the line of best fit, and finding the equation of the line.Step 3 - Inspire: Students choose an independent activity, complete a short reading, and then appl
Grades:
9th - 12th
Types:
CCSS:
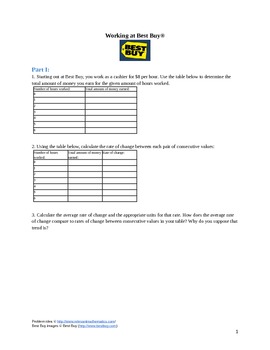
Graphing Functions - Earn Some Money
Looking for an activity to teach students how to graph basic functions? This activity has students create a table of values, graph, and equation from a word problem about earning money working for Best Buy.
Subjects:
Grades:
8th - 9th
Types:
Showing 1-8 of 8 results


