8 results
Other (math) graphic organizers for Microsoft Publisher
1/2 inch square graph paper
I use this in my class for all operations to ensure place value remains correct. The boxes are larger so the kids can write in the them.
Please follow me so when I post a new item you will be notified.
Feel free to email me with requests for alternate programs.
Most pages are black and white so they can be easily printed or copied.
Subjects:
Grades:
PreK - 3rd
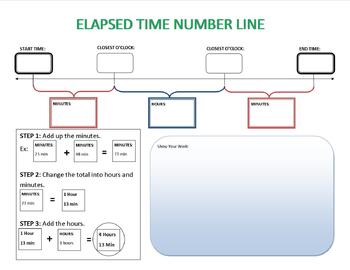
Elapsed Time Number Line Graphic Organizers
This is a graphic organizer for students to use when trying to find how much time has elapsed between two times. It can be laminated and used as a center practice activity.
To use this graphic organizer, first plug in the Start Time and End Time for the problem. Then think about the closest hour (O'Clock Time) after the start time and before the end time. You should have the top row of boxes filled in on the organizer. Next calculate the number of minutes in between the Start Time and O'clock t
Subjects:
Grades:
2nd - 4th
Types:

4th Grade CCSS Data Tracker (Editable)
This document includes a data table with student names down the side to track student progress toward each of the 4th grade Common Core Math Standards. The standard is listed at the top, with 5 data points that can be entered for each standard. This is a simple way to keep track student and class progress toward each standard.
Subjects:
Grades:
4th
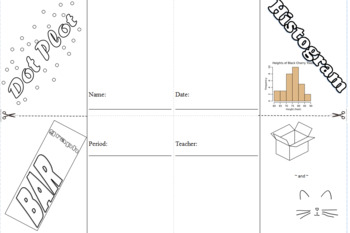
Data Graphs Foldable
This foldable can be used for notes, remediation, a formative assessment. This foldable can be used in interactive notebook classrooms as well when it folds it fits perfectly in one and has space for glue/staples/tape on the back. It includes histogram, box and whisker, dot plot, and bar graphs. Students must answer questions about each style of data graph and then they must show how the graph looks with the example data provided. I have my students complete this on larger paper and then give th
Subjects:
Grades:
7th - 9th

Emoji Grading Scale
This is a banner with emojis that students K thru 5th use as a visual to better understand their grades. This helps them focus on their desired grades and report card goals. Print as big or small as you'd like.
Simply add a title of your choice with cut out letters.
**YOU MUST HAVE PUBLISHER 2013 OR HIGHER TO DOWNLOAD THIS FILE.
Grades:
K - 5th
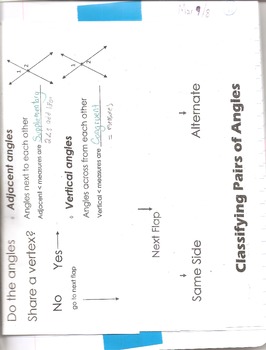
Parallel Lines and Transversals- classifying angles
this foldable guides students step by step in identifying pairs of angles formed by a pair of parallel lines crossed by a transversal
Subjects:
Grades:
6th - 11th
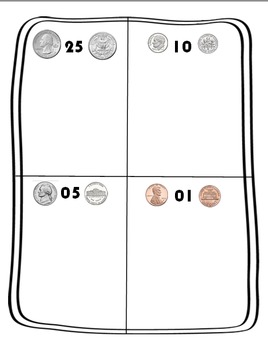
First Grade Money Mat
A mat to help students sort coins when learning about money!
Subjects:
Grades:
K - 2nd
Types:
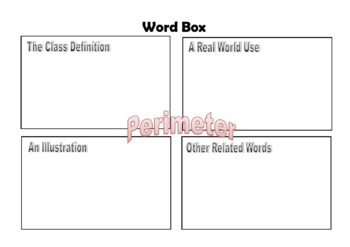
Perimeter Word Box
A tried and tested literacy tool used in the Mathematic world to assist students to think in different ways. Great for whole class, pairs or individual use. Great for educators investing in deeper learning.
Subjects:
Grades:
4th - 6th
Showing 1-8 of 8 results


