34 results
High school statistics interactive whiteboards $5-10
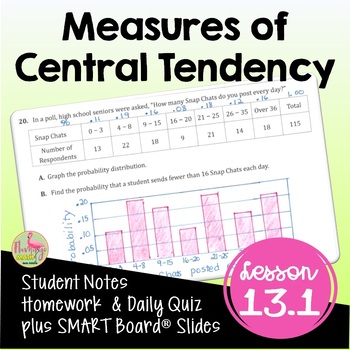
Measures of Central Tendency (Algebra 2 - Unit 13)
Measures of Central Tendency Algebra 2 Lesson:Your Pre-AP Algebra 2 Honors students will draw, analyze and interpret box-and-whisker plots, find outliers, and calculate measures of central tendency in this unit 13 lesson on Data Analysis & Statistics that cover the concepts in depth. #distancelearningtptWhat is included in this resource?⭐ Guided Student Notes⭐ Google Slides®⭐ Fully-editable SMART Board® Slides⭐ Homework/Practice assignment⭐ Lesson Warm-Up (or exit ticket)⭐Daily Content Quiz
Subjects:
Grades:
8th - 11th, Higher Education
CCSS:
Also included in: Algebra 2 Curriculum Mega Bundle | Flamingo Math
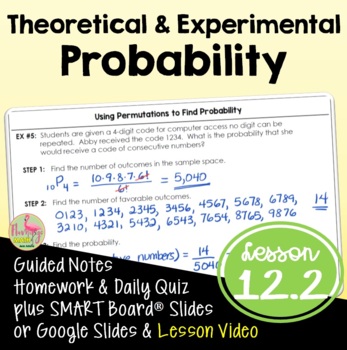
Theoretical and Experimental Probability (Algebra 2 - Unit 12)
Theoretical & Experimental Probability Algebra 2 Lesson:Your Pre-AP Algebra 2 Honors students will find both experimental and theoretical probabilities in this Unit 12 lesson. #distancelearningtptWhat is included in this resource?⭐ Guided Student Notes⭐ Google Slides®⭐ Fully-editable SMART Board® Slides⭐ Homework/Practice assignment⭐ Lesson Warm-Up (or exit ticket)⭐ Daily Content Quiz (homework check)⭐ Video Lesson Link for Distance Learning - Flipped Classroom models⭐ Full solution setStude
Subjects:
Grades:
8th - 11th, Higher Education
CCSS:
Also included in: Algebra 2 Curriculum Mega Bundle | Flamingo Math
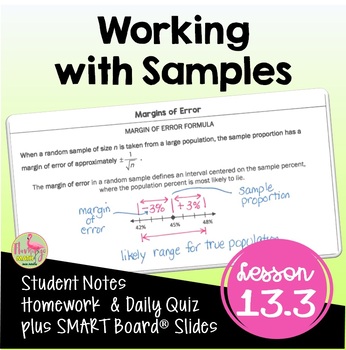
Working with Samples (Algebra 2 - Unit 13)
Working with Samples Algebra 2 Lesson:Your Pre-AP Algebra 2 Honors students will find draw, analyze and interpret box-and-whisker plots, find outliers, and calculate measures of central tendency in this unit 13 lesson on Data Analysis & Statistics that cover the concepts in depth. #distancelearningtptWhat is included in this resource?⭐ Guided Student Notes⭐ Google Slides®⭐ Fully-editable SMART Board® Slides⭐ Homework/Practice assignment⭐ Lesson Warm-Up (or exit ticket)⭐Daily Content Quiz (ho
Subjects:
Grades:
8th - 11th, Higher Education
CCSS:
Also included in: Algebra 2 Curriculum Mega Bundle | Flamingo Math
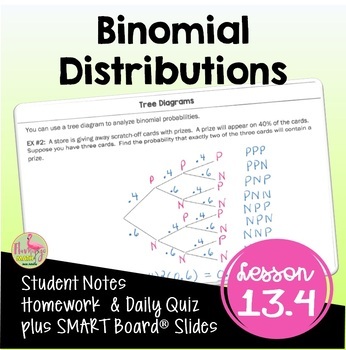
Binomial Distributions (Algebra 2 - Unit 13)
Binomial Distributions Algebra 2 Lesson:Your Pre-AP Algebra 2 Honors students will calculate measures of central tendency, draw, analyze, and interpret box-and-whisker plots and find outliers using binomial distributions in this Unit 13 lesson. #distancelearningtptWhat is included in this resource?⭐ Guided Student Notes⭐ Google Slides®⭐ Fully-editable SMART Board® Slides⭐ Homework/Practice assignment⭐ Lesson Warm-Up (or exit ticket)⭐ Daily Content Quiz (homework check)⭐ Video Lesson Link for Dis
Subjects:
Grades:
8th - 11th, Higher Education
CCSS:
Also included in: Algebra 2 Curriculum Mega Bundle | Flamingo Math

Statistics animated powerpoint template lesson part 1
Statistics animated lesson:content:1.Introduction2.Discrete Data3.Continuous Data4.Central Tendancy of a Data Set
Subjects:
Grades:
8th - 9th
Also included in: Statistics animated powerpoint lesson template

Statistics animated powerpoint lesson template part 2
Statistics part 2:1.Range and Interquartile Range2.Box and Whisker Plot
Subjects:
Grades:
8th - 9th
Also included in: Statistics animated powerpoint lesson template
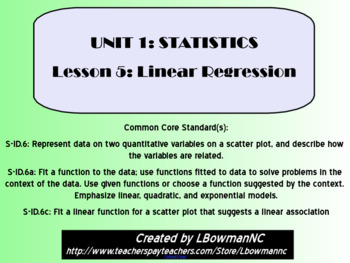
Linear Regression and the Correlation Coefficient (Math 1)
This lesson is the fifth of six lessons in the Math 1 Statistics Unit.
This lesson includes important vocabulary, examples (guided practice), and class work (independent practice). At the end of the presentation is a Ticket Out the Door that can be used as a formative assessment.
There is a note-taking guide for the students to fill out as the teacher goes through a SMART Notebook presentation.
Unit 1: Statistics
Lesson 1: Mean Median Mode Range Outliers and Skew
Lesson 2: Box and Whisker
Subjects:
Grades:
6th - 12th
CCSS:
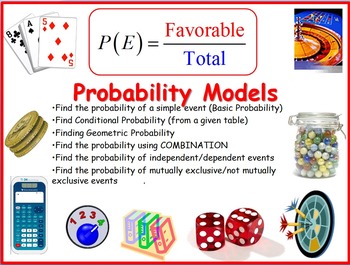
Probability Models
This handout drills the understanding of the different models of probability. Student would have to first determine under which model should this problem fit, then, apply the appropriate strategy to answer the questions. There are many ways to answer each of the questions provided in this handout. I provided "An" answer key.
In this handout, you will find a set of 40 questions on the following probability models:
1. Detailed visual description of the Standard Deck of Cards
2. Basic Probab
Subjects:
Grades:
6th - 12th, Higher Education, Adult Education, Staff
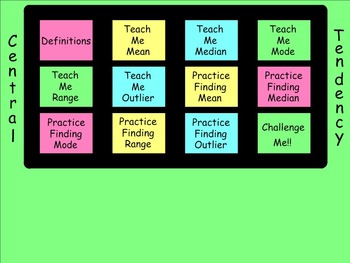
How I Teach Finding Mean, Median, Mode, Range, and Outliers
This is a 70 page Smartboard file covering Central Tendency. The students are given definitions for Mean, Median, Mode, Range, and Outlier. They are also taught how to find each when given a list of numbers. There are plenty of practice pages for each and all include answers. There is also a section of more challenging problems at the end. All pages are linked to a central homepage so that no matter where you are in the file it will always be easy to navigate around.
Subjects:
Grades:
6th - 9th
Types:
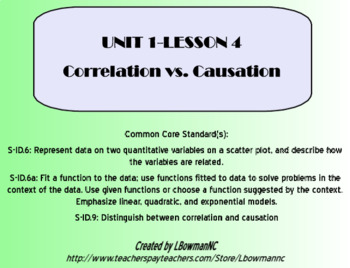
Correlation vs Causation (Math 1)
This lesson is the fourth of six lessons in the Math 1 Statistics Unit.
This lesson includes important vocabulary, examples (guided practice), and class work (independent practice). At the end of the presentation is a Ticket Out the Door for the students.
There is a note-taking guide for the students to fill out as the teacher goes through a SMART Notebook presentation.
Unit 1: Statistics
Lesson 1: Mean Median Mode Range Outliers and Skew
Lesson 2: Box and Whisker Plots
Lesson 3: Standard
Subjects:
Grades:
6th - 12th
CCSS:
Mean Median Mode Range Outliers and Skew (Math 1)
This lesson is the first of six lessons in the Math 1 Statistics Unit.
This lesson includes important vocabulary, examples (guided practice), and class work (independent practice). The examples and class work are broken up in to two separate "chunks". This allows the students to establish a foundation for the topics covered before moving on to more challenging problems. At the end of the presentation is a Ticket Out the Door that can be used as a formative assessment.
There is a note-taking g
Subjects:
Grades:
6th - 12th
CCSS:
Standard Deviation (Math 1)
This lesson is the third of six lessons in the Math 1 Statistics Unit.
This lesson includes important vocabulary, examples (guided practice), and class work (independent practice). The examples and class work are broken up in to two separate "chunks". The first chunk requires the students to calculate the standard deviation by hand. The second chunk requires the students to find the standard deviation using a graphing calculator and then to use standard deviation to compare different sets of d
Subjects:
Grades:
6th - 12th
CCSS:
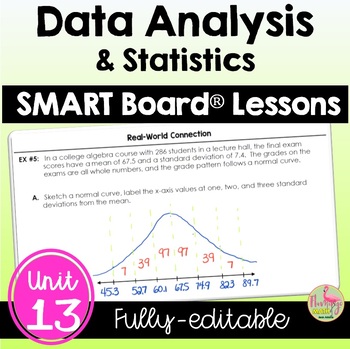
Data Analysis and Statistics SMART Board® Lessons (Algebra 2 - Unit 13)
Data Analysis & Statistics SMART Board Bundle:This bundle of SMART Board® presentations for Algebra 2 Honors students covers Unit 13: DATA ANALYSIS & STATISTICS. You have total freedom to alter and revise each fully-editable SMART Notebook® file. Then, you can teach and present your lesson with any compatible Interactive Whiteboard. There are 108 slides to cover the concepts in depth.The unit includes the following topics:1) Measures of Central Tendency2) Analyzing Data3) Working With S
Subjects:
Grades:
8th - 11th, Higher Education
CCSS:
Residuals (Math 1)
This lesson is the last of six lessons in the Math 1 Statistics Unit.
This lesson includes important vocabulary, examples (guided practice), and class work (independent practice) on how to find the residual values for a linear regression model. At the end of the presentation is a Ticket Out the Door for the students.
There is a note-taking guide for the students to fill out as the teacher goes through a SMART Notebook presentation.
Unit 1: Statistics
Lesson 1: Mean Median Mode Range Outli
Subjects:
Grades:
6th - 12th
CCSS:
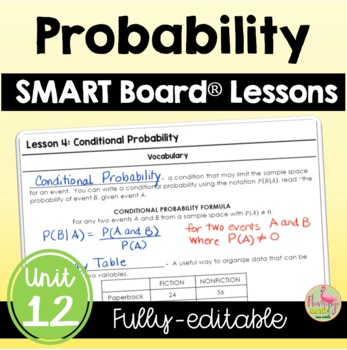
Probability SMART Board® Lessons (Algebra 2 - Unit 12)
This bundle of SMART Board® presentations for Algebra 2 Honors students covers Unit 12: PROBABILITY. You have total freedom to alter and revise each fully-editable SMART Notebook® file. Then, you can teach and present your lesson with any compatible Interactive Whiteboard. There are 82 slides to cover the concepts in depth.***(6/28/2022) Updated and revised.The unit includes the following topics:1) Permutations and Combinations2) Theoretical and Experimental Probability3) Independent and Depende
Subjects:
Grades:
8th - 11th, Higher Education
CCSS:
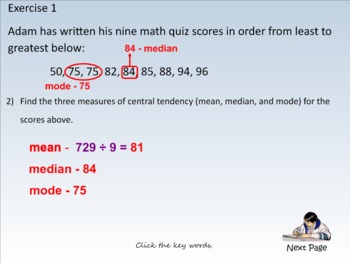
Stats - Lesson 1 Measures of Central Tendency
Lesson guides students to determine which measure of central tendency best represents a data set. Lesson also guides students to making predictions on how changes in a data set may affect the mean, median and mode.
This is a complete set: Student class work pages (PDF), Interactive teaching tool (SmartBoard file), and homework assignment (PDF).
Includes learning goals and answers to student class work.
Subjects:
Grades:
6th - 9th
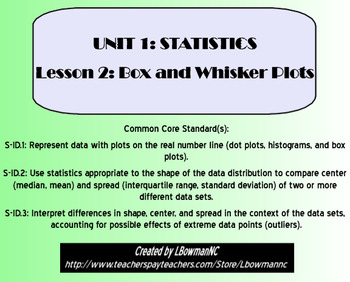
Box and Whisker Plots (Math 1)
This lesson is the second of six lessons in the Math 1 Statistics Unit.
This lesson includes important vocabulary, examples (guided practice), and class work (independent practice). The examples and class work are broken up in to two separate "chunks". This allows the students to establish a foundation the basics of the topics covered before moving on to more challenging problems. At the end of the presentation is a Ticket Out the Door for the students.
There is a note-taking guide for the s
Subjects:
Grades:
6th - 12th
CCSS:
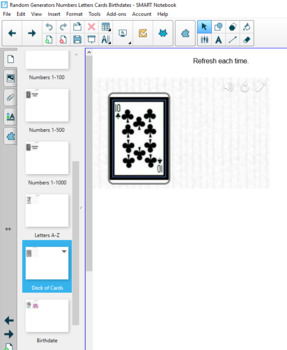
Random Number Letter Deck of Cards Birthday Generator SMART 18 Flash Replacement
If your district has upgraded to Windows 10 and SMART 18, then many of your highly-used flash components will no longer work. I have been recreating them in the new SMART 18. These Random Generators (Numbers 1-36, Numbers 1-100, Numbers 1-500, Numbers 1-1000, Letters A-Z, Playing Card from a Deck of Cards, & Birthdate) are comparable to what was previously available in SMART, though they operate differently.Random Generators SMART 18 Flash Replacement by Brian Tillmann is licensed under a Cr
Subjects:
Grades:
K - 12th, Staff
Types:
CAHSEE Review -- Statistics, Data Analysis, Probability
All California public school students must pass the California High School Exit Examination (CAHSEE) in order to receive a high school diploma.
This PowerPoint is used as a review prior to the exam. These are the 30 released questions from the Statistics, Data Analysis, and Probability section.
Other CAHSEE PowerPoints:
Algebra & Functions CAHSEE Review
Mathematical Reasoning CAHSEE Review
Number Sense CAHSEE Review
Geometry CAHSEE Review
Algebra 1 CAHSEE Review
Subjects:
Grades:
10th - 11th
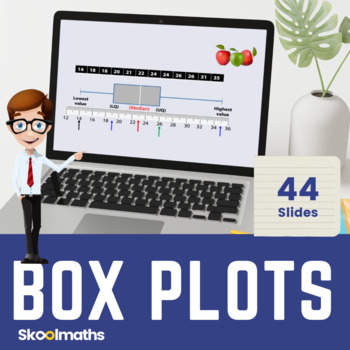
Box and Whisker Plots Digital Lesson and Activities for Middle School
Box and Whisker Plots Digital Lesson and Activities for Middle SchoolBox Plots is a completely interactive lesson designed for Middle school to High School Statistics and Probability.Contents:This bundle pack contains:44 interactive slides with dynamic graphics that will engage your studentsInteractive Drag and Drop activities on find averages as well as instant learner feedbackPrintable Worksheets with answers includedDifferentiated questions and answersCan be used as Home Learning Resource and
Subjects:
Grades:
6th - 9th
Also included in: Complete Statistics and Probability Bundle | Digital and Print
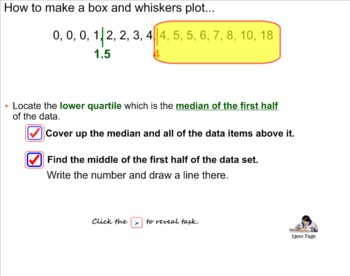
Stats - Lesson 2 Constructing Box and Whisker Plots
Teach your students how to construct box and whisker plots using the files in this packet: SmartBoard teaching tool, student class work pages, student procedure guide, and homework assignment.
Everything is ready for you..."click and go!"
Subjects:
Grades:
6th - 9th
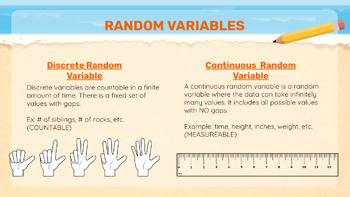
Normal Distributions and Random Variables Lesson: High School Statistics
Updated as of 5/28: With Think-Write-Pair-Shares and more guided practice during the lesson. This is a guided lesson on normal distributions and random variables. The lesson walks students through examples on how to identify discrete and continuous variables. It also goes over normal distributions, the empirical rule, and how to find z-scores. This lesson includes examples that you can use to walk students through the problems. If you teach with a tablet, iPad, or a Smart board, this lesson is a
Subjects:
Grades:
10th - 12th
CCSS:
Also included in: Normal Distributions and Random Variables Bundle: High School Statistics
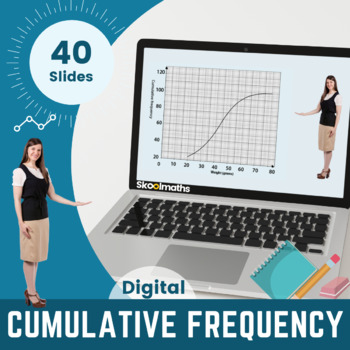
Cumulative Frequency - Digital Lesson and Activities for 9th-10th Grade
In this lesson, learners will be able to:1) construct and interpret cumulative frequency graphs, 2) interpret, analyze and compare the distributions of data sets through quartiles and inter-quartile range The lesson can be used as whole class teaching by teachers and at home by learners.Lots of drag and drop activities with instant feedback. Contains 40 interactive pagesTo open this lesson you need to unzip or extract the files.Choose index.html to view onlineThis lesson can also be viewed offl
Subjects:
Grades:
9th - 10th, Higher Education, Staff
Also included in: Complete Statistics and Probability Bundle | Digital and Print
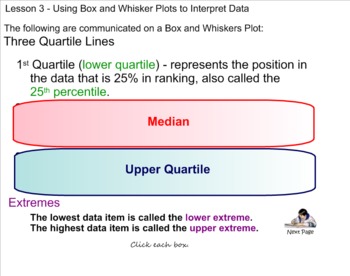
Stats - Lesson 3 Interpreting Box and Whisker Plots
Challenging questions lead students justify conclusions based upon box and whisker plots that they construct.
Zip File includes: SmartBoard teaching tool, student note and class work pages (PDF) and homework assignment (PDF).
EXTRA BONUS - SmartBoard file with homework answers and explanations.
Subjects:
Grades:
6th - 9th
Showing 1-24 of 34 results


