37 results
Elementary statistics resources for Microsoft Excel
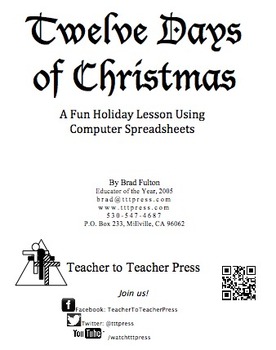
12 Days of Christmas: A Computer Spreadsheet Activity
This great holiday activity shows students how to use a computer spreadsheet to calculate the cost of their true love's gifts in today's dollars.The simple step-by-step procedure will allow both beginning and computer-savvy students to experience success as they learn how to use spreadsheet software. Students will enjoy the engaging and entertaining activity. No computer? No problem! Use the activity master so students can calculate the costs themselves.
Grades:
5th - 9th
Types:
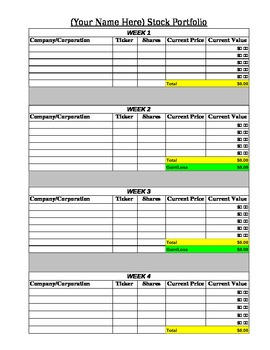
Stock Market Portfolio Tracking Spreadsheet
This document is an Excel spreadsheet which has already been formulated for students to use as part of a Stock Market unit. As students research and track their stocks, they will enter their data into the spreadsheet and their profit/loss will be automatically calculated along with a graph for students to analyze their results.
Subjects:
Grades:
4th - 8th
Types:
Printable Graph Paper 10 Squares Per Inch Cross Stitch
Printable Graph Paper 10 Squares Per Inch Cross Stitch - Grid paper is essentially the type of paper most commonly used for drawing and sketching purposes. It is widely used for making plan charts, designing websites, developing home ideas and so forth. A great deal of businesses who need to produce a company card, business brochures, catalogues, brochures, and so forth need this kind of graph paper.
Subjects:
Grades:
5th - 12th

Water Balloon Catcher Project - Data and Graphing - Mathematics
Transform your maths classroom into a dynamic hub of learning with this captivating data and graphing project! Designed for upper primary/middle school students, this hands-on and inquiry-based activity ensures an immersive experience in mastering data interpretation, chart creation, and understanding the role of data and graphs in advertising.In this engaging project, students will: Explore Data: Collaborate in teams to design and construct a Water Balloon Catcher using recycled materials, each
Subjects:
Grades:
5th - 9th
Types:
Manage Sports Statistics in Google Drive / Google Sheets - Activity
Use Google Sheets to analyze sports data
This activity lets students practice several fundamental spreadsheet skills, including:
-renaming documents
-adding formulas
-inserting / formatting charts
Screenshots demonstrate how to do all of the above in Google Sheets, the spreadsheet application in the Google Drive suite. You can add additional statistics to customize the assignment for your students and adjust the level of difficulty.
Aligned to the following Massachusetts Technology Literacy
Grades:
5th - 8th
Types:
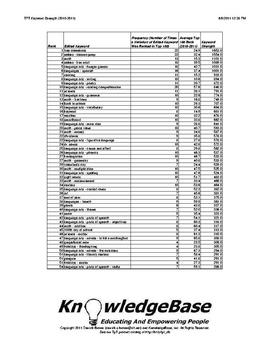
TPT KeyWord Strength Index (2010-2011) - Downloadable Spreadsheet!
What are the strongest keywords on TpT?
1. free downloads
2. Deanna Jump
3. math
Neither #1 nor #2 are surprises, but #3 (math) was certainly a surprise to me!
This report analyzes TpT's 2010-2011 keywords using a measure called "keyword strength".
The measure is based on a keyword's average rank, as well as the number of times it appeared in the 2010-2011 "Top 100" TpT search engine rankings.
This can be a valuable tool to help sellers understand TpT's marketplace supply and demand!
The P
Subjects:
Grades:
PreK - 12th, Higher Education, Adult Education, Staff
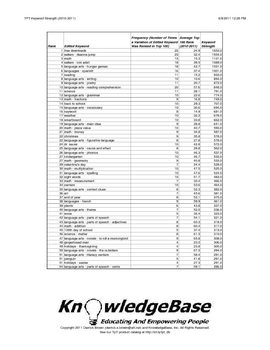
TPT KeyWord Strength Index (2010-2011) - Downloadable PDF!
What are the strongest keywords on TpT?
1. free downloads
2. Deanna Jump
3. math
Neither #1 nor #2 are surprises, but #3 (math) was certainly a surprise to me!
This report analyzes TpT's 2010-2011 keywords using a measure called "keyword strength".
The measure is based on a keyword's average rank, as well as the number of times it appeared in the 2010-2011 "Top 100" TpT search engine rankings.
This can be a valuable tool to help sellers understand TpT's marketplace supply and demand!
The P
Subjects:
Grades:
PreK - 12th, Higher Education, Adult Education, Staff
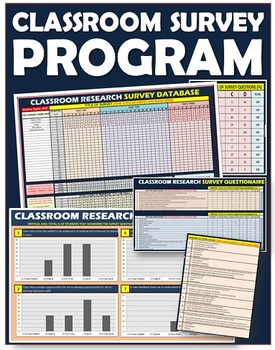
Surveys: Classroom All-IN-ONE Research Program
Empower Your Teaching with Data: Enhance Your Classroom with Powerful Survey Analysis!Elevate your teaching practice by leveraging the power of data with this user-friendly survey analysis program.Here's what sets it apart:Effortless Data Visualization: Transform survey responses into clear and visually appealing charts and graphs.Actionable Insights: Gain valuable insights into student learning styles, preferences, and areas for improvement.Informed Decisions: Make data-driven decisions to enha
Subjects:
Grades:
PreK - 12th, Higher Education, Adult Education, Staff
Types:
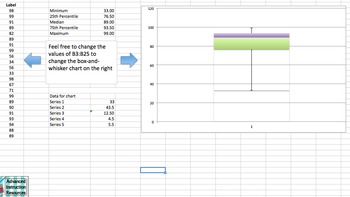
Box and Whisker Plot - Excel Template
This Excel box-and-whisker plot template allows the user to enter data and watch as the maximum, minimum, median, and quartiles change. The changes will also happen to the box-and-whisker plot that has already been created for you. I've used this to show how different values impact the quartiles within a box-and-whisker plot. It's also another way to showcase the formulas in finding central tendency terms. Enjoy!
Subjects:
Grades:
5th - 8th
Types:
CCSS:
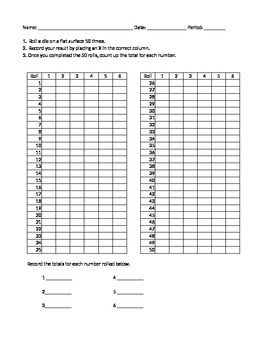
Die Probability Activity
Students roll a die 50 times and record the data on the data sheet.
Total up each column.
Write results as a fraction, decimal, and percent.
Answer questions comparing theoretical and experimental probability.
Need 1 die per student or small group of students.
Subjects:
Grades:
5th - 7th
Types:
CCSS:
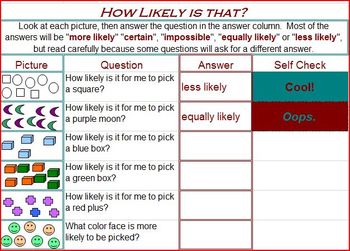
Interactive Game: Probability
GREAT FOR CENTERS! This game is a great quick check of student understanding for basic probility situations. Students type responses and are given immediate feedback. At the end, the worksheet is printable and already scored.
There are two separate games on the same file. The tabs at the bottom of the workbook are labeled.
Subjects:
Grades:
2nd - 5th

Math TEKS standards checklist for K-12th grade (TX)
Mathematic TEKS standards checklist for K-12th grade. These are on an Excel spreadsheet with 5 columns for data input and separate tabs for the strands. These standards are organized in their separate strands to coordinate lessons. Please see my free file for an example.
Subjects:
Grades:
K - 12th
Types:
Spreadsheet Interactive Lesson {6.SP.4}
Looking for step by step instructions for interactive note booking using spreadsheets? This file is exactly what you need! There are complete instructions for notebook organization and how students use a self assessment stop light graphic organizer to communicate their comprehension of the lesson. This lesson includes complete instructions and student black line masters. There are also pictures of sample pages. My student's favorite part of this lesson is entering the data on computers and creat
Subjects:
Grades:
4th - 8th
Types:
CCSS:
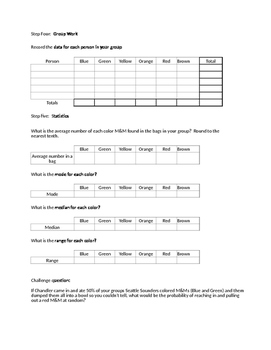
M & M Review Activity
This activity tests students on their knowledge of fractions, decimals, and percents. It also test probability, statistics, and graphing. To make the activity easier presort bags of M&M to ensure easy fractions. Use fun-size bags to make the activity shorter. Use regular size bags or tubes of mini M&M to stretch the activity out and/or make it more challenging.
The activity asks students to sort a bag of M & M into colors and record the information on a table. Then students a
Subjects:
Grades:
3rd - 7th
Types:
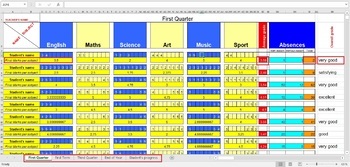
Calculate Student's Final Marks ( Grades ) in excel
If you want to easily calculate student's marks this excel document is great solution. I added all excel's necesarily formulas to make this important task so easier.When you add the marks for every subject, it's final mark will be automatically calculated. At the same time average grade will also be calculated and updated.There is also section for absences (excused and unexcused) which will also be calculated.At the end, if student's Overall grade is equal or above 4.5, it will be automaticaly w
Subjects:
Grades:
PreK - 12th, Higher Education, Adult Education, Staff
Types:
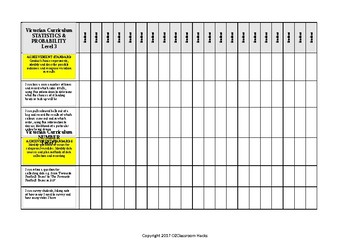
Mathematics STATISTIC PROBABILITY Checklist Level 3 Victorian Curriculum 'I Can'
Level 3 Statistics and Probability Checklist aligned with the Victorian Curriculum. Fed up with recreating new checklists - ME TOO! Hope this helps. Here is a checklist completely aligned with the Victorian Curriculum. All put simply in 'I Can' statements as YOU WOULD TEACH IT!
MAKE LIFE SIMPLE! Teaching is time consuming enough.
Subjects:
Grades:
PreK - 6th
Types:
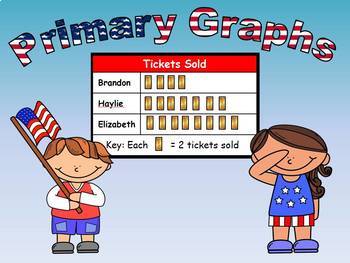
Primary Graphs Unit (Line Plot, Bar, Pictograph, Pie, and Line)
This compressed files contains all the materials you need to teach your primary students about graphing 7 different data surveys as line plots, bar graphs, or pictographs. Inside the folder is a PowerPoint presentation to teach the concepts as your students complete each of the 7 graphs. (There is also an equivalent SmartBoard Notebook presentation of the same lesson)• CCSS.Math.Content.1.MD.C.4• CCSS.Math.Content.2.MD.D.10Also included is an Excel spreadsheet that will show your primary student
Subjects:
Grades:
K - 2nd
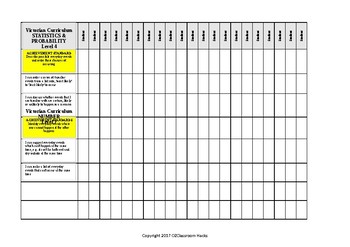
Mathematics STATISTIC PROBABILITY Checklist Level 4 Victorian Curriculum 'I Can'
Level 4 Statistics & Probability Checklist aligned with the Victorian Curriculum. Fed up with recreating new checklists - ME TOO! Here is a checklist completely aligned with the Victorian Curriculum, with 'I Can' statements breaking down each achievement standard.
These checklists can be used for assessment, reporting and for planning your curriculum so that you know you are covering everything set out in the Victorian Curriculum.
Each of these I Can statements can be used in your weekly pla
Subjects:
Grades:
2nd - 7th
Types:
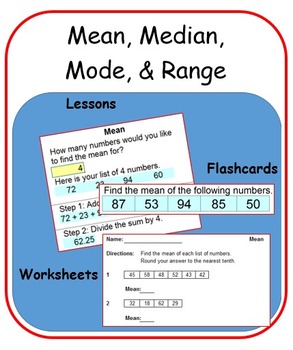
Mean, Median, Mode, & Range
Use the magic of Microsoft Excel to generate countless examples, stimulate discussion, and build student confidence and competence in calculating mean, median, mode, and range.
ALL the work has been done for you! All you have to do is:
1. Open the downloaded Excel file.
2. Click on one of the lesson tabs located at the bottom of the screen.
3. Press the appropriate key(s) to generate an example (F9 for PC; Command + Equal for Macs).
4. Demonstrate, discuss, review, and learn.
5. Then with a si
Subjects:
Grades:
4th - 7th
Types:

Editable School Building Energy Saving Form
Do you have Watt Watchers or an energy savers club at your school? Need a quick and efficient way to track teachers wasting energy in their rooms? This form is divided by grade level, then by teacher. All you need to do is edit teacher names and student names and tracking the whole school will be a breeze!!
Subjects:
Grades:
3rd - 12th, Staff
mean, median, mode, and range Unit
Multiple classroom activities working towards finding the mean, median, mode, and ranges. Offers short projects, as well as, long range projects.
Subjects:
Grades:
4th - 8th
Math - Data Management using Technology
This lesson is a detailed example of how Microsoft Excel can help not only statisticians, but the regular student complete tasks in a way that is functional, efficient and easy to read. It is a fantastic tool that helps the student build an appreciation and awareness of how to communicate properly in math. This lesson will allow students to reflect on the topic of “mean” within Data Management and encourage them to clarify and build on their mathematical arguments.
Lastly, this is a perfect w
Grades:
5th - 9th
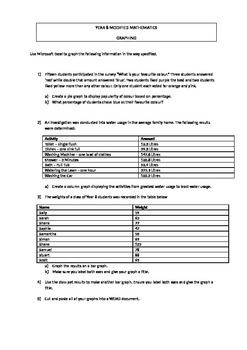
Using ICT to investigate Statistics
A quick activity encouraging students to incorporate the use of ICTs into their learning about Statistics. Requires them to use Microsoft Excel to create different types of graphs based upon the statistics given in the worksheet.
Subjects:
Grades:
4th - 10th
Types:
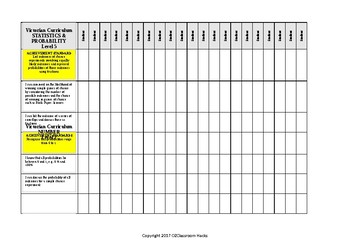
Mathematics STATISTICS and PROB Checklist Level 5 Victorian Curriculum in 'I Can
Level 5 STATISTICS and PROBABILITY Checklist aligned with the Victorian Curriculum. Fed up with recreating new checklists - ME TOO! Here is a checklist completely aligned with the Victorian Curriculum, with 'I Can' statements breaking down each achievement standard.
These checklists can be used for assessment, reporting and for planning your curriculum so that you know you are covering everything set out in the Victorian Curriculum.
Each of these I Can statements can be used in your weekly plann
Subjects:
Grades:
3rd - 7th
Types:
Showing 1-24 of 37 results


