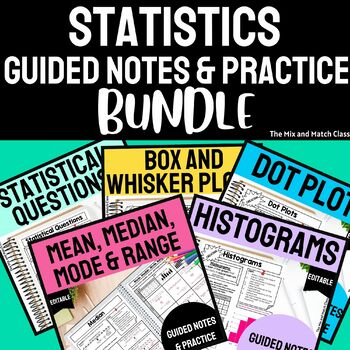
Statistics Notes Bundle EDITABLE
- Zip
What educators are saying
Products in this Bundle (5)
Description
This EDITABLE statistical notes bundle includes statistics notes and statistics practice worksheet problems for 6th grade! Are you looking to teach or reinforce mean, median, mode and range? Do you want easy to use statistical questions notes? An organized way to teach dot plots, histograms, and box and whisker plots are all included!
Included you will find:
Statistical Questions Notes and Practice
Box and Whisker Plots Notes and Practice
Mean, Median, Mode, and Range Notes and Practice
You can use these as graphic organizers to teach the concept, as exit tickets, as classwork, or as homework!
⭐ 1. Statistical Questions Notes and Practice
This includes an EDITABLE file to help you teach statistical questions with a notes sheet and practice statistical questions worksheets to help introduce the concept of statistical questions. You can use these as graphic organizers to teach the concept of statistical questions, as exit tickets, as classwork, or as homework!
Included you will find:
- 1 step-by-step note sheet to introduce how to determine whether a question is a statistical question
- 1 practice page to determine whether questions are statistical AND change non-statistical questions to be statistical questions
- 1 practice page to create statistical questions when given a topic
⭐ 2. Dot Plots Notes and Practice
This file includes an EDITABLE dot plot guided note sheet and dot plot practice worksheets to help introduce the concept of creating dot plots and analyzing dot plots. You can use these as graphic organizers to teach the concept of dot plots, as dot plot exit tickets, as dot plot classwork, or as dot plot homework!
Included you will find:
- 1 page step-by-step note sheet introducing what dot plots are and how to create dot plots
- 1 page of creating dot plots practice worksheet
- 3 pages of practice for creating and analyzing dot plots
For each page listed above, there is also an identical page for differentiating for higher learners that includes a blank number line instead of a completed number line.
⭐ 3. Histograms Notes and Practice
This is an EDITABLE bundle to introduce creating histograms and analyzing histograms. You can use these histogram worksheets as graphic organizers to teach the concept, as histogram exit tickets, as histogram classwork, or as histogram homework!
Included you will find:
- 1 page step-by-step note sheet to introduce histograms are and how to create histograms
- 1 page of practice for creating histograms worksheet
- 2 pages of analyzing histogram worksheets
⭐ 4. Box and Whisker Plots Notes and Practice
This is an EDITABLE file to introduce creating box and whisker plots and analyzing box plots. You can use these box plot worksheets as graphic organizers to teach the concept, as box and whisker plot exit tickets, as box plot classwork, or as box and whisker plot homework!
Included you will find:
- 2 page step-by-step note sheets to introduce what box and whisker plots are and how to create box plots
- 5 pages of practice for creating box plots worksheets (10 problems)
- 7 pages of analyzing box and whisker plots worksheets (5 problems) *problems #1-3 have differentiated number lines
⭐ 5. Mean, Median, Mode, and Range Notes and Practice
This is an EDITABLE file to introduce measures of center including mean, median, mode, and range with step by step guided notes! You can use these as graphic organizers to teach the concept, as exit tickets, as classwork, or as homework! The answer keys are perfect for distance learning!
Included you will find:
1 page basic introduction to measures of center notes
1 page step-by-step note sheet to teach the mean/average of a set of numbers
1 page step-by-step note sheet to teach the median of a set of numbers
1 page step-by-step note sheet to teach the mode of a set of numbers
1 page step-by-step note sheet to teach the range of a set of numbers
2 pages for students to practice finding the mean, median, mode, and range of a set of numbers
★★★★★★★★★★★★★★★★★★★★★★★★★★★★
All answer keys are included! This can even be printed off and given to students as needed, too! This can be used for students who were absent, students who have accommodations, or to upload for distance learning after the lesson.
Use as guided notes, practice worksheets, classwork, homework, or exit tickets!
*This is a .zip folder with both a .pdf and an editable .pptx file.
★★★★★★★★★★★★★★★★★★★★★★★★★★★★
Click HERE to follow my store - be the first to know about new products, sales, and freebies!
★★★★★★★★★★★★★★★★★★★★★★★★★★★★
Did you know you can earn TPT credits to use toward future purchases by leaving a review? Simply go to your My Purchases page, click on the leave a review link next to the product, and give your feedback. Each time you leave feedback, TPT gives you credits to lower the cost of your future purchases! You might be surprised by how many free credits you have!
Your feedback means the world to me - I'd love to know how you & your students liked the resource. Each time someone buys a resource, I know I'm helping to make an impact in another classroom. Thank you! :)


