
Graphing Worksheets NO PREP PRINTABLES


- PDF
What educators are saying
Also included in
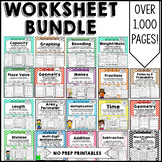 This is a collection of over 1,000 worksheets that will cover your entire 3rd grade year and more! These worksheets are perfect for homework, classwork, centers, and distance learning. No prep is involved! All you need to do is print. My students really enjoy these worksheets because each page is fuPrice $72.90Original Price $81.00Save $8.10
Description
This is a collection of 52 Fun and Educational Graphing Worksheets! This graphing worksheet packet focuses on bar graphs, pictographs, tally graphs, and line plots. Students will work on reading graphs and creating graphs in this educational packet. These graphing worksheets are perfect for homework, classwork, and centers. No prep is involved! All you need to do is print. My students really enjoy these worksheets because each page includes a fun activity. All worksheets include jokes, word scrambles, cut and paste, mazes, matching, and more! Check out the preview for a sample of some of the worksheets! These worksheets are geared towards third grade but also work really well in second!
Content for the Worksheets Includes:
Bar Graphs
Reading a bar graph
Creating a bar graph
Pictographs
Reading a pictograph
Creating a pictograph
Tally Graph
Reading a tally graph
Creating a tally graph
Line Plots
Reading a line plot
Creating a line plot
Math VA SOL Standards:
SOL 3.15a, 3.15b
Common Core Standards:
Interested in more Worksheets?
Looking for more Graphing Activities?
Check out my Graphing Exit Tickets FREEBIE
