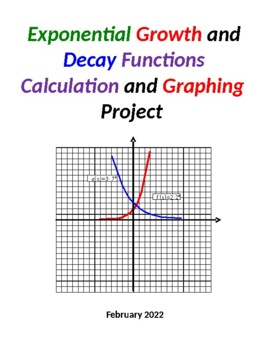
Exponential Growth & Decay Functions Calculation & Graphing Project
- Word Document File
Description
PLEASE NOTE: THE PREVIEW VERSION OF THIS PRODUCT IS THE ACTUAL "STUDENT VERSION" AND DOES NOT INCLUDE ANY OF THE ANSWERS TO THE PROBLEMS. THE "PRODUCT VERSION" INCLUDES DETAILED ANSWERS TO ALL OF THE PROBLEMS FOR THE PROJECT.
This activity involves the calculation, graphing and coloring of exponential growth and decay functions. I have my Algebra 1/Math 1/Math 2 students complete this project toward the end of the unit on exponential functions.
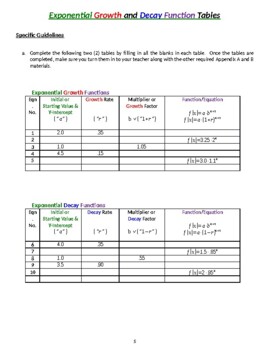
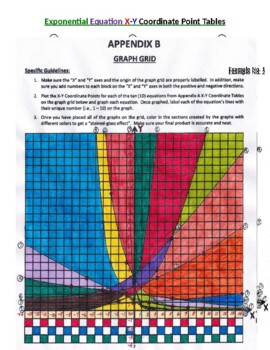
A total of five (5) exponential growth functions and five (5) exponential decay functions (10 total) are to be solved and then graphed by the students. A function table is provided for the students to complete for the 5 exponential growth functions and a second table is to be completed for the 5 exponential decay functions. Once the exponential equations are determined, the students are to find a minimum of four (4) "x-y" coordinate points for each equation. These points are then plotted for each of the 10 equations and a smooth curve is to be drawn on the furnished graph grid for each equation. Finally the various sections formed by the intersecting lines of the plotted graphs are to be colored to provide a "stained glass effect" final product.
This activity is organized to be completed by individual students; but teachers could have students work in pairs or teams as desired to complete the project. It usually takes two, 1 hour class periods to completely finish all parts of the activity; but the calculation and basic graphing parts of it can be completed in 1 class period, if desired, and the graph grid coloring part completed in a 2nd class period or assigned as homework.
This activity package is an MS Word file and includes the following:
- Activity Description Section
- Appendix A - Student Worksheets
- Appendix B - Graph Grid
- Appendix C - Grading Rubric
- Appendix D - Teacher Answer Key Material including all calculations, solution answers and graphs (uncolored and colored) for all parts of the activity
In addition two (2) sample colored graph grid examples are also included at the end of the activity package. There are 13 total pages in the package. The native MS Word file is included in the event the teacher desires to make any modifications to the activity to suit her or his classroom purposes.
Other MS PPT products for 6th Grade, 7th Grade, 8th Grade, Math 1, Math 2, Math 3, Algebra 1, Algebra 2, Geometry and PreCalculus curriculum topics can be reviewed and purchased under my TpT page titled: "Priceless Math".


