Demographics- compare your class the the U.S. Census!
Dan Vandenheede
17 Followers
Grade Levels
8th - 12th
Subjects
Formats Included
- Word Document File
- Internet Activities
- Excel Spreadsheets
Pages
3 pages
Dan Vandenheede
17 Followers
Compatible with Digital Devices
The Teacher-Author has indicated that this resource can be used for device-based learning.
Description
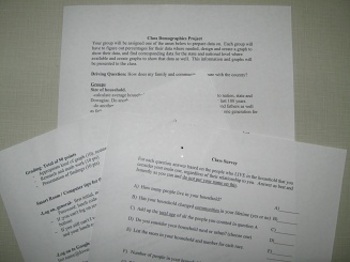
This demographic project starts with a class survey which is used to collect census style data for the households represented in your class. The class is then divided into groups to research different demographic characteristics of their town, state and country using the U.S census data available online as well as the data collected form the class. The areas researched include employment, size of household, age, race and ethnicity and where we live and how we move. After researching and finding their information they create a presentation with graphs showing their data and other relevant facts. Emphasis is on the comparison between their class and town data and the rest of the country so they are able to see how their community reflects, or does not reflect, the larger population. I have had them produce posters for graphs, powerpoint presentations or a combination. Currently I have them use google drive t create graphs on a spreadsheet and copy them over to a drive presentation which they share with me for showing in the class. The assignment includes instructions on using google drive, how to do census research, and a grading rubric.
Total Pages
3 pages
Answer Key
N/A
Teaching Duration
1 Week
Report this resource to TPT
Reported resources will be reviewed by our team. Report this resource to let us know if this resource violates TPT’s content guidelines.


