Data and Graphing Project - Real World Math Project Based Learning Activities
- PDF
What educators are saying
Also included in
- Your 4th and 5th grade students will love working on the engaging math projects included in this bundle! Use these real world math projects as end of unit activities, alternative ways to assess student learning, or fun ways to integrate math and art. You save 20% off the price of the individual resPrice $11.40Original Price $14.40Save $3.00
Description
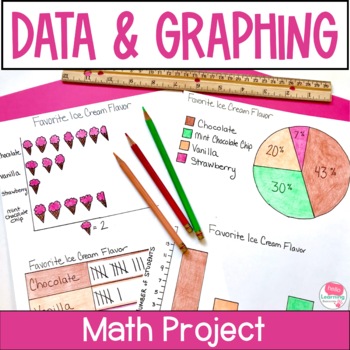
This data and graphing project gives your students a meaningful way to apply their data and graphing skills. Use this real world math project as an end of unit activity, enrichment activity or assessment. Easy to use and fun for students!
Click the PREVIEW button above to see everything that is included in this fun math project!
⭐ This resource includes:
- teacher information, directions and sample schedule
- supply list
- grading rubric
- student direction sheet
- two data collection sheets (one for open ended responses, one for pre-selected category responses)
- Data landmarks vocabulary reference sheet
- Types of graphs reference sheet
- Extension ideas (3 different extension activities and student direction sheets)
- Misleading data and graphs activity
- Photo examples
⭐ In this project students will:
- formulate a question
- survey classmates
- collect data
- analyze and interpret data
- determine data landmarks- mean, median, mode, maximum, minimum, range, outliers
- create four graphs to display their data
- present their final project to the class
Students have a lot of choice built in to this project which makes it highly engaging!
⭐ Students get to choose:
- their survey question
- what types of responses they will accept (open ended or pre-selected categories)
- how they will represent their data on graphs and which graphs they will create
Your students will LOVE doing this project!
It is the perfect math project for the end of the year or to wrap up a math unit on graphs and data.
This graphing project can take anywhere from 1-2 weeks, depending on how much class time students have to work on the project and whether or not you use the extension ideas. You can control how much time you want to spend on it.
You may also like my:
Follow me and be notified when new products are added to my store.
New products are always 50% off for the first 24 hours they are posted!
Thanks!
- Dawn - Hello Learning


