TPT
Total:
$0.00

Analyzing Darwin's Finches- Evolution Graphing Activity

Rated 4.86 out of 5, based on 262 reviews
4.9 (262 ratings)
;
Science Lessons That Rock
8.9k Followers
Grade Levels
8th - 11th
Resource Type
Standards
Formats Included
  • Zip
  • Google Apps™
Pages
16 pages
$3.50
$3.50
Share this resource
Report this resource to TPT
Science Lessons That Rock
8.9k Followers
Includes Google Apps™
The Teacher-Author indicated this resource includes assets from Google Workspace (e.g. docs, slides, etc.).

What educators are saying

You can never have too many graphing activities for students to help with understanding. This was a great resource combining a few concepts we had discussed in class
My students worked independently on this assignment, I combined it with the Tortoise activity of yours. It was easy to understand and aligned with the standards. Thanks
Also included in
  1. Bundle and save with this evolution unit! Check out the previews of the lessons, labs, and activities included in your purchase!Be sure to follow my TpT store by clicking on the green "follow me" next to my seller picture to receive notifications of new products and upcoming sales. Don't forget to l
    Price $62.40Original Price $78.00Save $15.60

Description

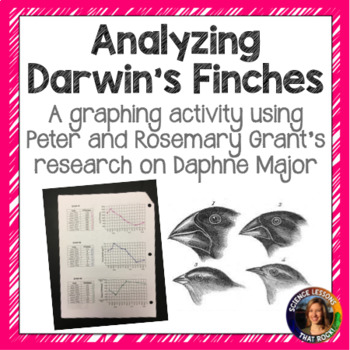
How do we know Darwin was right about evolution via natural selection? In this activity students will read/learn about Peter and Rosemary Grant, a couple from Princeton University who traveled to the Galapagos to conduct research. Students will learn what happened to the finch population on Daphne Major following a severe drought, and again following an El Nino. Students will graph data from the Grant's research and answer questions.

This is a great activity to include with the HHMI video clip found here.

If you enjoyed this lesson, check out my other evolution lessons!

Galapagos Tortoises- Speciation activity

Analyzing Darwin's Finches graphing activity

Battle of the Beaks Lab FREEBIE

Evolution Writing Prompts

Evolution Bundle

Be sure to follow my TpT store by clicking on the green "follow me" next to my seller picture to receive notifications of new products and upcoming sales. 

Don't forget to leave feedback to earn TpT credits that can be used for future purchases! 

Want free tips and resources sent to your inbox once a week? Subscribe to my newsletter! You can also...

♻️ Check out my blog

♻️ Follow me on facebook

♻️ Follow me on instagram

♻️ Follow me on pinterest

Total Pages
16 pages
Answer Key
Included
Teaching Duration
50 minutes
Report this resource to TPT
Reported resources will be reviewed by our team. Report this resource to let us know if this resource violates TPT’s content guidelines.

Standards

to see state-specific standards (only available in the US).
NGSSHS-LS4-3
Apply concepts of statistics and probability to support explanations that organisms with an advantageous heritable trait tend to increase in proportion to organisms lacking this trait. Emphasis is on analyzing shifts in numerical distribution of traits and using these shifts as evidence to support explanations. Assessment is limited to basic statistical and graphical analysis. Assessment does not include allele frequency calculations.
NGSSHS-LS4-4
Construct an explanation based on evidence for how natural selection leads to adaptation of populations. Emphasis is on using data to provide evidence for how specific biotic and abiotic differences in ecosystems (such as ranges of seasonal temperature, long-term climate change, acidity, light, geographic barriers, or evolution of other organisms) contribute to a change in gene frequency over time, leading to adaptation of populations.
NGSSMS-LS4-4
Construct an explanation based on evidence that describes how genetic variations of traits in a population increase some individuals’ probability of surviving and reproducing in a specific environment. Emphasis is on using simple probability statements and proportional reasoning to construct explanations.
NGSSHS-LS4-5
Evaluate the evidence supporting claims that changes in environmental conditions may result in (1) increases in the number of individuals of some species, (2) the emergence of new species over time, and (3) the extinction of other species. Emphasis is on determining cause and effect relationships for how changes to the environment such as deforestation, fishing, application of fertilizers, drought, flood, and the rate of change of the environment affect distribution or disappearance of traits in species.

Reviews

Questions & Answers