26 results
Graphing Common Core 7.SP.C.5 resources
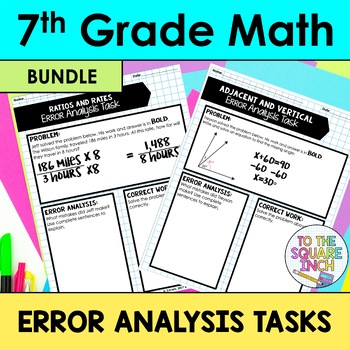
7th Grade Math Error Analysis Task Bundle
7th Grade Math Error Analysis Tasks- One task for each Common Core Standard*60 different error analysis tasks for each 7th Grade Common Core Standard. This is a bundle of 5 different products at over a 20% discount. Please click on each link to see individual product descriptions. The Number System Topics include: Terminating and Repeating DecimalsAdding Integers with Different SignsAdding Integers with the Same SignAdding Rational NumbersMultiplying IntegersDividing IntegersMultiplying Rational
Subjects:
Grades:
6th - 8th
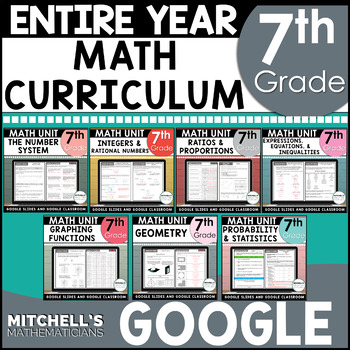
7th Grade Math Curriculum Bundle CCSS Aligned
Looking to integrate technology into your 7th grade math curriculum? This common core aligned product engages your seventh grade students through interactive Google slides. You can assign this to your students digitally or print the slides and distribute them to you students in your classroom. This bundle includes: The number system, integers and rational numbers, percents, ratios, proportions, similar figures, expressions, equations, inequalities, graphing functions, slope, constant of proport
Subjects:
Grades:
7th - 8th
Types:
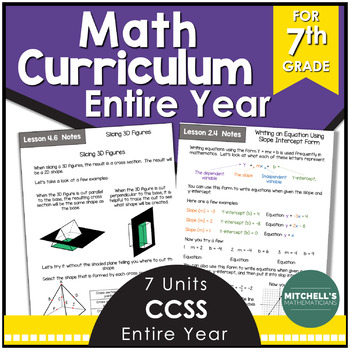
7th Grade Math Curriculum Common Core Aligned BUNDLE
Looking for a NO PREP 7th grade math curriculum that is engaging and rigorous? This common core aligned product is perfect for your seventh grade students. This bundle includes: The number system, integers and rational numbers, percents, ratios, proportions, similar figures, expressions, equations, inequalities, graphing functions, slope, constant of proportionality, geometry, statistics and probability. It is all you will need and more to have an amazing 7th grade year. Just print and go.Unit
Subjects:
Grades:
6th - 8th
Types:
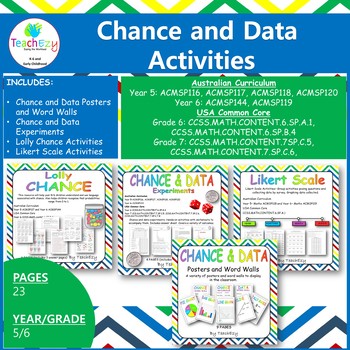
Chance and Data Bundle
1. Likert Scale Activity⭐ Engaging activity for the classroom. Likert Scale Activities– Group activities posing questions and collecting data by survey, followed by graphing data collected.→ 5 pagesAustralian CurriculumYear 5– Maths ACMSP118 and Year 6– Maths ACMSP119USA Common CoreCCSS.MATH.CONTENT.6.SP.A.12. Chance and Data Lollies⭐ This resource will help Year 5 /6 children understand and use language associated with chance. Also helps children recognise that probabilities range from 0 to 1.→
Subjects:
Grades:
5th - 7th
Types:
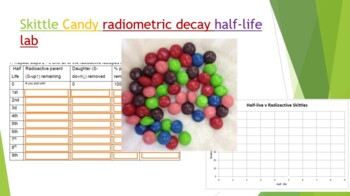
Skittle Radiometric Decay Half-life Lab
Did you know you can use Skittles candy to demonstrate absolute dating and radiometric decay! Buy a 1-4 lb bag at your local bulk warehouse store for savings. This lab is a great way to show how isotopes decay by shaking a plate full of random skittles. Students use Skittles to observe "Isotopes" decay over each half life. At the end of the lab (and only IF they have done all their work) they can enjoy their "daughter products". Skittles were used because they are durable, hypoallergenic, and th
Subjects:
Grades:
8th - 12th, Higher Education, Adult Education
Types:
NGSS:
HS-PS1-8
, HS-PS1-1
, HS-PS1-4
, HS-PS1-6
, MS-PS1-4
...
Also included in: Hands-on Science Semester Labs Bundle
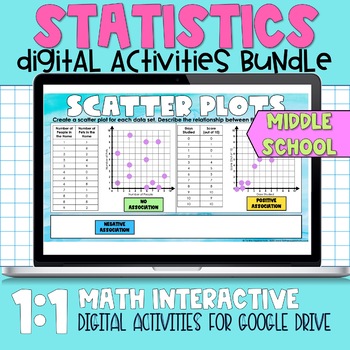
Statistics Digital Activities
Middle School Math Statistics Digital Activities for Google Drive for Distance Learning Activities Included:1. Histograms2. Statistical Questions 3. Scatter Plots4. Stem and Leaf Plots5. Line Plots6. Measures of Central tendency 7. Box and Whisker Plot
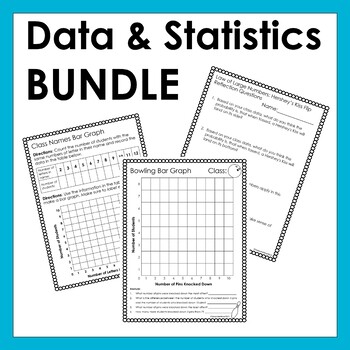
BUNDLE:Graphing, Probability, Data Collecting Activities/Stations Middle School
7-Activity/Station Data Day This download includes seven different data and statistics activities. These activities promote math group discussions, team work, and creativity in mathematics and great for students who are visual and hands on learners. Activity #1: Name Bar GraphsTeach your students about bar graphs by creating a class wide bar graph using your student’s names. This download provides directions as well as student work pages to graph the names of their classmates. Needed Materials
Subjects:
Grades:
5th - 8th
Types:
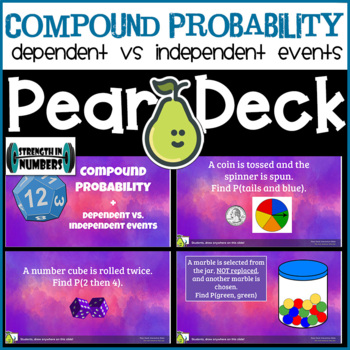
Compound Probability Independent/Dependent Events Google Slides/Pear Deck
This product includes a digital Google Slides presentation with a PearDeck add-on. Great for in-person or distance learning. The slides can be used alone for a class presentation but are meant to be used with the Pear Deck add-on. Simply open the slides, make a copy, go to Add-ons → Pear Deck and then click the green “start lesson” button on the right hand side where the Pear Deck options pop up. Using a free Pear Deck account to present this to your class either in person, remotely, or hybr
Subjects:
Grades:
6th - 9th
Also included in: 7th Grade Math 7 Complete Year BUNDLE 41 Google Slides/Pear Deck
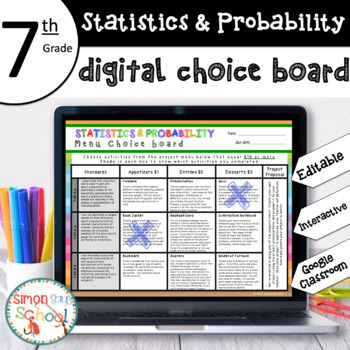
7th Grade DIGITAL Statistics & Probability Choice Board - Distance Learning
7th Grade DIGITAL Statistics and Probability Enrichment Choice Board – EDITABLE – NO PREP This editable DIGITAL choice board for Google Drive™ is an amazing differentiation tool for distance learning that not only empowers students through choice but also meets their individual needs. You will find that the fractions enrichment board contains three leveled activities for each standard: appetizer, entrée, and dessert from my printable resource: 7th Grade Statistics and Probability Enrichment Cho
Subjects:
Grades:
7th
Types:
Also included in: 7th Grade DIGITAL Math Choice Board Bundle for Distance Learning
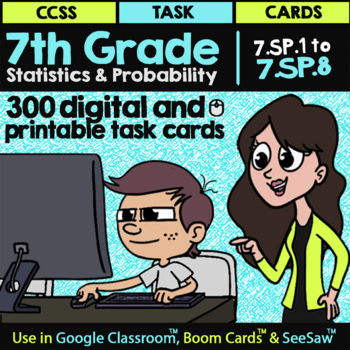
Statistics & Probability Activities | 7th Grade Word Problems | 7.SP.1 - 7.SP.8
Are you looking for a unit's worth of engaging printable & digital activities that cover the 7.SP Common Core Domain (Statistics & Probability) while being immediately implementable in printable and digital formats? If that sounds like something you might be interested in, I'm confident this product is going to meet and exceed your expectations!If accessed digitally, these task card sets can be pre-loaded as no-prep assessments/assignments through Google Forms™, Google Slides™, or as a B
Subjects:
Grades:
7th - 8th
Types:
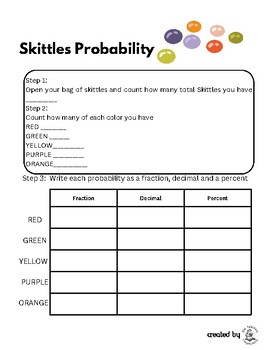
Skittles Probability - Middle School Math Activity
Great introduction to the concept of experimental probability. Engage your students with this interactive activity. Explore the concepts of mean, median, and mode. Create a pie graph (pie chart) showing your findings
Subjects:
Grades:
6th - 8th
Types:
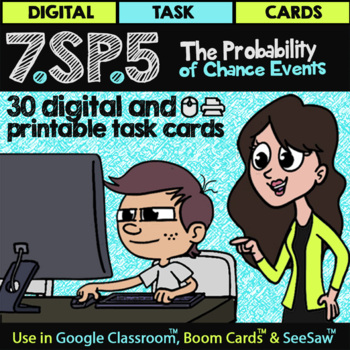
Intro to Probability of Chance Events Activity | Word Problems & Practice 7.SP.5
Are you looking for a fun and flexible differentiated* activity that provides a rich variety of practice problems for Common Core Standard 7.SP.5 (The Probability of Chance Events). We've set up this these common core-aligned digital and printable task cards so that they can be seamlessly integrated into your lesson plan whether you are teaching in class or remotely. (with little to no prep work). ============================These graphing equations and inequalities digital activities are one-cl
Subjects:
Grades:
7th - 8th
Types:
CCSS:
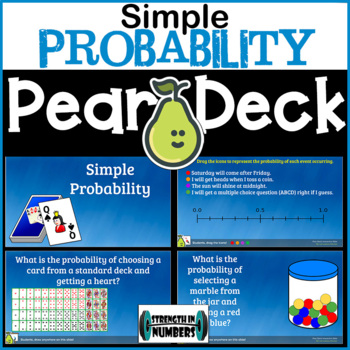
Simple Probability Digital Activity for Google Slides/Pear Deck
This product includes a digital Google Slides presentation with a PearDeck add-on. Works great with in-person or distance learning. Watch students work in real time and share answers with the class without showing names. The slides can be used alone for a class presentation but are meant to be used with the Pear Deck add-on. Simply open the slides, make a copy, go to Add-ons → Pear Deck and then click the green “start lesson” button on the right hand side where the Pear Deck options pop up.
Subjects:
Grades:
6th - 9th
Also included in: 7th Grade Math 7 Complete Year BUNDLE 41 Google Slides/Pear Deck
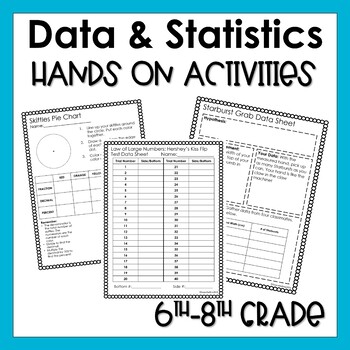
Data & Statistics Day: Mean, Median, Mode, Probability, Pie Chart 6th, 7th, 8th
3-Activity Data Day This download includes three different data and statistics activities. These activities promote math group discussions, team work, and creativity in mathematics and great for students who are visual and hands on learners. Activity #1: Skittles Pie ChartsTeach your students about pie charts using Skittles. Students work with Skittles to make a pie chart and then figure out the fraction and percent each color takes up. This downloads provides directions as well as student work
Subjects:
Grades:
6th - 8th
Types:
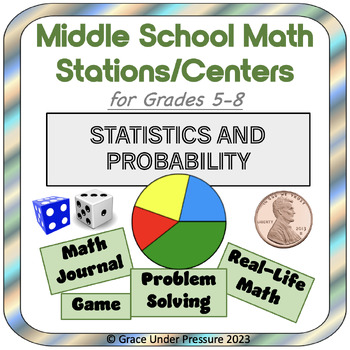
5 Middle School Math Stations: Statistics & Probability Math Test Prep (Gr 5-8)
This ready-to-go set of 5 stations/centres will supplement a unit about statistics and probability: including probability using dice, spinners, and coins; calculating measures of central tendency- mean, median, and mode; and converting theoretical and experimental probability into percentages. There are word problems, real world math activities, games, and a journal prompt. These activities could be a great test prep activity for your class!Station 1: Students solve four word problems using prob
Subjects:
Grades:
5th - 8th
Types:
6 Editable Bar Graph Templates 2.0
Finally a simple and professional graph space that students can fill out without any design issues getting in the way. This file contains 6 ready-to-use graph options. Print them and have students fill them with pencil and ruler, or distribute them over computer and let them practice entering the data. Get a project perfect finish every time. Maybe you just want to fill it out live on a projector? The possibilities are endless! It's okay to say you love these bar graphs. So do we.Contains:- 2 bl
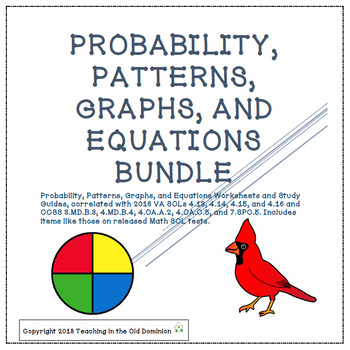
Probability, Patterns, Graphs, and Equations Mini-unit BUNDLE
Probability and Patterns Worksheets and Study Guide including determining the likelihood of an event, representing probability as a number, creating models or practical problems to represent probability, and patterns found in objects, pictures, numbers, and tables. Correlated with 2016 VA SOL 4.13 and 4.15 and CCSS 4.OA.C.5 and 7.SPC.5. The calculator symbol indicates that the problems in this unit will appear on the section of the Grade 4 Virginia SOL Math test that allows a calculator. I
Subjects:
Grades:
3rd - 7th
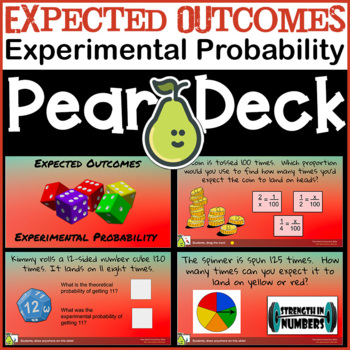
Expected Outcomes and Experimental Probability Google Slides/Pear Deck
This digital product includes a digital Google Slides presentation with a PearDeck add-on. Works great with in-person or distance learning. Watch students work in real time and share answers with the class without showing names. The slides can be used alone for a class presentation but are meant to be used with the Pear Deck add-on. Simply open the slides, make a copy, go to Add-ons → Pear Deck and then click the green “start lesson” button on the right hand side where the Pear Deck options p
Subjects:
Grades:
6th - 9th
Also included in: 7th Grade Math 7 Complete Year BUNDLE 41 Google Slides/Pear Deck
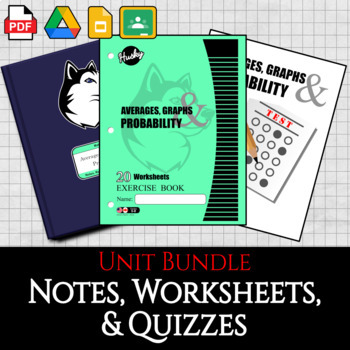
Middle School - Averages Data Statistics and Probability Unit
Ultimate Bundle: Averages, Graphs, & ProbabilityFor the unit on measures of central tendency, data & statistics, and probability. This bundle comes with a textbook, notes, unit planning & study guide, guided note taking for students, worksheets, quizzes, a unit test, and answer keys for the whole thing. These resources come in PDFs which are ready to print in both color and black & white versions, as well as Google Slide resources, ready to use with Google Classroom. Geared towar
Subjects:
Grades:
6th - 8th
Types:
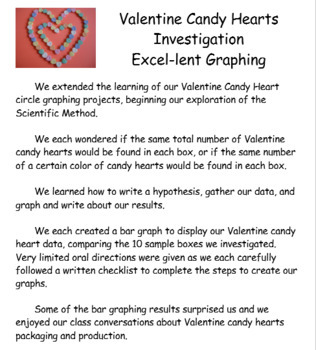
Excel Graphing Valentine Candy Hearts Investigation
#welovecandyheartsThis integrated Math/ Science/ Technology project is a great way to make statistics and probability real, relevant, fun, and delicious!Students will create bar graphs using Excel to display Valentine candy hearts data, as students consider packaging and production of small Valentine candy heart individual boxes. Project file includes sample bulletin board display poster, project directions in individual student checklist form, and rubric to grade the finished graph.Project file
Grades:
5th - 7th
Types:
NGSS:
3-5-ETS1-2
, MS-ETS1-3
A Fun Introduction to Probability
This product contains fourteen pages that introduce probability by graphing the LEGOs and comparing the number of studs on LEGO bricks. These statistics will be figured in fractions, decimals and percentages. Graphing will be done on bar graphs and pie graphs. The worksheets are colorful and engaging for students. Students will learn to find the mean, median and mode of different numbers of studs on LEGO bricks. Students will find their own statistics and combine them with the statistics of ot
Subjects:
Grades:
4th - 9th
Probability of Independent Events Using Sample Space Smartboard Slides Lesson
Probability-of-Independent-Events-Using-Sample-Space Smartboard-Lesson has lots of interactive practice for your students. 23 slides in all! Great graphics and problems! Your students will LOVE this lesson! You'll use it year after year! WARNING: You MUST have SMART Technologies SMART software, and a SMARTBOARD to teach from, to effectively download, open and use this Interactive Smartboard Lesson. Go to https://legacy.smarttech.com/en/products/education-software/smart-learning-suite/download/tr
Subjects:
Grades:
5th - 8th, Staff
Experimental Probability: Paper Wads
In this activity, students will play "trashketball" to gather data to use for experimental probability. Students will use this data to find mean, median and mode as well. This is fun activity to find probability while keeping kids active and involved.
Subjects:
Grades:
6th - 7th
Types:
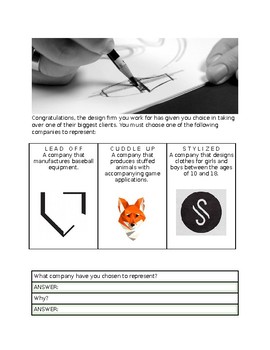
Product Design Math Project
Let your students delve into the real world application of percents, statistics, and graphing.
They will choose one of three company focuses that need a new product. Students will create questions to survey classmates or schoolmates in order to guide their design.
They will categorize that data and create various graphs, percentage statements, and a presentation.
All of these steps are followed through the steps of design thinking.
Showing 1-24 of 26 results


