11 results
Preschool statistics resources for Microsoft Word
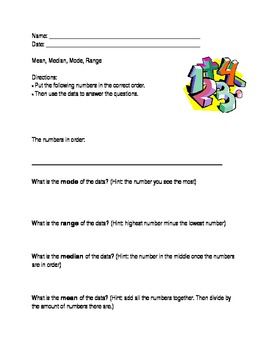
Mean, Median, Mode, Range; Modified Special Ed Math Template; Statistics
This is a modified worksheet from the middle school statistics curriculum. It is excellent for special education students who require an alternate or modified curriculum.
This worksheet allows teachers to input numbers in the blank space. This way teachers can use the template over and over with different numbers. Students are then to write the numbers in the correct order. Then, they have to find the mean, median, range, and mode. There are "hints" (formulas) that help the students differentia
Grades:
PreK - 12th
Types:
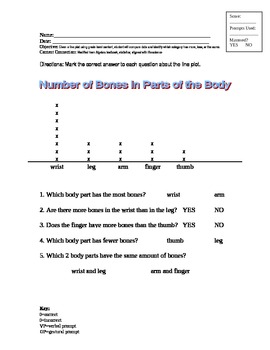
Reading a Line Plot; Modified Curriculum for Special Ed, Statistics
This line plot is modified from the middle school statistics curriculum. It is excellent for special education students who require an alternate or modified curriculum. The line plot is related to life science, and shows how many bones are in five different parts of the body. The questions on the worksheet ask questions about more and less. The answers are offered in a field of two.
This worksheet aligns with Maryland content standard:
Given a line plot using grade level content, student will c
Subjects:
Grades:
PreK - 5th
Types:
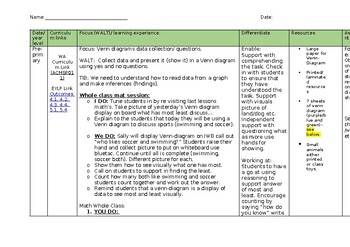
Venn Diagram lesson plan and resources
Lesson plan for teaching students how to use a Venn Diagram Pintables included for whole class and independent learning
Subjects:
Grades:
PreK - 6th
Types:
CCSS:

VicVELs Child Friendly Stats and Probability Footsteps Foundation to 6
Student friendly lists of VicVELs achievement standards for Statistics and Probability for Foundation to Level 6. These achievement standards are presented in a fun way for students and translated into child friendly language. Standards have also been broken into individual statements.
Subjects:
Grades:
PreK - 6th
Types:
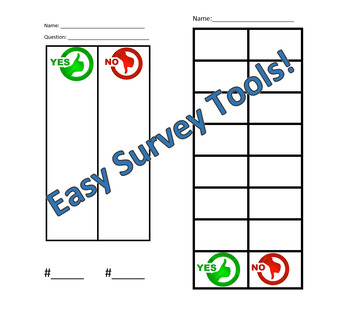
Easy Survey Tally Chart
Use this simple survey tally chart to help kids as young as 3 gather information. The chart is designed for yes or no questions.
Subjects:
Grades:
PreK - 1st
Types:
VicVELS Statistics and Probability Achievement Standards Class Checklist
VicVELs Achievement Standards for Statistics and Probability presented in a class checklist for primary levels, foundation to level 6. Great assessment tracker tool.
Subjects:
Grades:
PreK - 6th
Types:
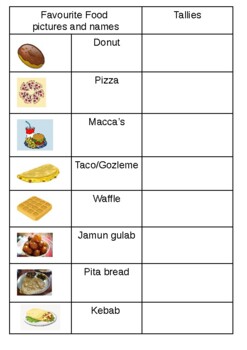
Maths - Data representation - favourite food pictograph activity cut and paste
Australian (Victorian Curriculum Year 1 and 2 levels), Maths - statistics and probability - Gathering data in a pictograph, modelling with class p.1, and task p. 2-4.Page 1 can be used as a teacher model and class data collection and pages 2-4 is the task for students that may use this for cut and paste activity to represent data using pictures for a pictograph. Foods are relatable to students of all countries.
Subjects:
Grades:
PreK - 4th
Types:

Penny Toss Recording Sheet
Recording sheet for the penny toss game. Goes along with the Toss the Chips game from the Investigations math series.
Subjects:
Grades:
PreK - 2nd
Types:

Sochi Olympic Medal Tally
A tally chart to keep track of Olympic achievement. Can be editted to fit classroom needs.
Subjects:
Grades:
PreK - 12th
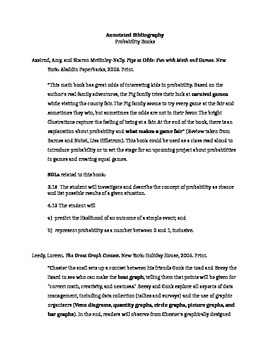
Probability Books
Integrate Math and Language Arts lessons with this annotated bibliography of great children's books to introduce probability and statistics to students.
Subjects:
Grades:
PreK - 2nd
Types:
Showing 1-11 of 11 results


