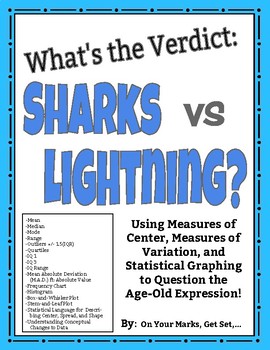
What's the Verdict: Sharks vs. Lightning? Modes of Center, Spread, and More!
- PDF
Description
Put it to the test! Use the age-old expression: "You are more likely to get struck by lightning than to be bitten by a shark!" to learn and practice Measures of Center, Measures of Spread, Measures of Shape, and Statistical Graphing including:
MEAN
MEDIAN
MODE
RANGE
OUTLIERS [Using IQR +/- 1.5(IQR)]
QUARTILES [lower quartile (IQ-1) and upper quartile (IQ-3)]
INTERQUARTILE RANGE (IQR)
MEAN ABSOLUTE DEVIATION/ M.A.D. ft. ABSOLUTE VALUE
SYMMETRY/ASYMMETRY OF DISTRIBUTION
CLUSTERS AND GAPS
BELL SHAPED CURVE AND SKEWEDNESS
FREQUENCY CHARTS
HISTOGRAMS
STEM-and-LEAF PLOTS
BOX-and-WHISKER PLOTS
PARAGRAPH WRITING to DESCRIBE DISTRIBUTION MEASURES and DATA
OBSERVATION
Covers the following standards for 6th and 7th grade Statistics and Probability Strand:
CCSS.MATH.CONTENT.6.SP.A.2
Understand that a set of data collected to answer a statistical question has a distribution which can be described by its center, spread, and overall shape.
CCSS.MATH.CONTENT.6.SP.A.3
Recognize that a measure of center for a numerical data set summarizes all of its values with a single number, while a measure of variation describes how its values vary with a single number.
Summarize and describe distributions.
CCSS.MATH.CONTENT.6.SP.B.4
Display numerical data in plots on a number line, including dot plots, histograms, and box plots.
CCSS.MATH.CONTENT.6.SP.B.5
Summarize numerical data sets in relation to their context, such as by:
CCSS.MATH.CONTENT.6.SP.B.5.A
Reporting the number of observations.
CCSS.MATH.CONTENT.6.SP.B.5.B
Describing the nature of the attribute under investigation, including how it was measured and its units of measurement.
CCSS.MATH.CONTENT.6.SP.B.5.C
Giving quantitative measures of center (median and/or mean) and variability (interquartile range and/or mean absolute deviation), as well as describing any overall pattern and any striking deviations from the overall pattern with reference to the context in which the data were gathered.
CCSS.MATH.CONTENT.6.SP.B.5.D
Relating the choice of measures of center and variability to the shape of the data distribution and the context in which the data were gathered.
Draw informal comparative inferences about two populations.
CCSS.MATH.CONTENT.7.SP.B.3
Informally assess the degree of visual overlap of two numerical data distributions with similar variabilities, measuring the difference between the centers by expressing it as a multiple of a measure of variability.
CCSS.MATH.CONTENT.7.SP.B.4
Use measures of center and measures of variability for numerical data from random samples to draw informal comparative inferences about two populations.
*All data posed is meant for entertainment purposes and does not present a fully adequate or credible quantity of data to be used outside the scope of Sixth and Seventh grade practice on Statistics and Probability standards.


