
Proportional Relationships in Tables, Graphs and Equations - Task Cards - 7.RP.2


The Clever Clover
2.3k Followers
Grade Levels
6th - 8th, Adult Education, Homeschool
Subjects
Resource Type
Standards
CCSS7.RP.A.2
CCSS7.RP.A.2a
CCSS7.RP.A.2b
CCSS7.RP.A.2c
CCSS7.RP.A.2d
Formats Included
- PDF
Pages
9 pages
The Clever Clover
2.3k Followers
What educators are saying
"Fantastic resource! The materials I purchased on Teachers Pay Teachers exceeded my expectations. The content was well-organized, engaging, and a valuable addition to my teaching toolkit. Thank you for creating such high-quality resources!"
Also included in
 If you are looking for a solid resource to supplement your proportional relationships instruction, this is it! This resource includes task cards, worksheets, and assessments on proportional relationships in tables, graphs and equations. Below you will find a detailed description of each resource. PPrice $14.40Original Price $18.00Save $3.60
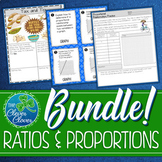 Use this resource for instruction on Ratios and Proportional Reasoning (Common Core Standards 7.RP.1 - 7.RP.3). Included you will find a variety of resources to use for complex fractions, proportional reasoning and practice with percents. Students will also benefit from bonus vocabulary activities.Price $34.40Original Price $43.00Save $8.60
Description
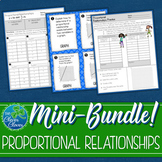
This resource includes twenty task cards divided into five stations about proportional reasoning. Students will strengthen their math vocabulary while collaborating and discussing proportional relationships. This resource is ready to print and implement during your proportional relationship unit.
You can save money by purchasing this resource in either one of the of the following bundles:
→ Ratios and Proportional Reasoning Bundle - 7.RP.1, 7.RP.2 and 7.RP.3
→ Proportional Relationships in Tables, Graphs and Equations
The stations include four questions on each of the following:
✸ graphs
✸ tables
✸ verbal descriptions
✸ equations
✸ ratios
Students are asked to explain how they know if a proportional relationship exists in a graph, table, and a verbal description. They are also asked to calculate the constant of proportionality and to identify it in a table, graph and equation.
Answer keys are included. Related Products
• Constant of Proportionality Worksheet
• Proportional Relationships Worksheets
Leaving feedback will earn you credits for future TPT resources. Follow Me to receive discounts for the first 24 hours on new resources.
Please contact me if you have any questions. The Clever Clover
Connect with me on social media!
The Clever Clover - Pinterest
The Clever Clover - Instagram
The Clever Clover - Facebook
Total Pages
9 pages
Answer Key
Included
Teaching Duration
45 minutes
Report this resource to TPT
Reported resources will be reviewed by our team. Report this resource to let us know if this resource violates TPT’s content guidelines.
Standards
to see state-specific standards (only available in the US).
CCSS7.RP.A.2
Recognize and represent proportional relationships between quantities.
CCSS7.RP.A.2a
Decide whether two quantities are in a proportional relationship, e.g., by testing for equivalent ratios in a table or graphing on a coordinate plane and observing whether the graph is a straight line through the origin.
CCSS7.RP.A.2b
Identify the constant of proportionality (unit rate) in tables, graphs, equations, diagrams, and verbal descriptions of proportional relationships.
CCSS7.RP.A.2c
Represent proportional relationships by equations. For example, if total cost 𝘵 is proportional to the number 𝘯 of items purchased at a constant price 𝘱, the relationship between the total cost and the number of items can be expressed as 𝘵 = 𝘱𝘯.
CCSS7.RP.A.2d
Explain what a point (𝘹, 𝘺) on the graph of a proportional relationship means in terms of the situation, with special attention to the points (0, 0) and (1, 𝘳) where 𝘳 is the unit rate.
Reviews
Questions & Answers
2.3k Followers
