Marine Science Lab: Calculating Biodiversity of a Rocky Intertidal Zone
- Zip
Also included in
- This is a custom bundle created specifically by a buyer, D.G.. If you like this bundle, you can buy it too, or request your own bundle from me - just fill out this Google Form to get your custom bundle started!Thank you! - Chris~~~~~~~~~~~~~~~~~~~~~~~☛ Custom Bundle Rules ☚Sale items or items alreadPrice $115.13Original Price $153.50Save $38.37
Description
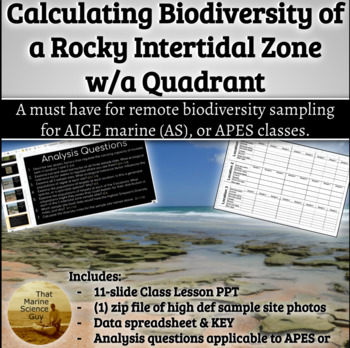
Product Description: Getting kids into the field is unfortunately not so easy all the time. This lab will bring the field to them. This activity (geared towards APES, AP Biology, or AICE marine students) will have your kids will examining photos from 3 seperate rocky intertidal zone ecosystems - here in Flagler county (see preview download above). The activity comes with a directions PPT, that also has tips on how to count all of the algae, and the dead barnacle shells, as well as how to identify common organisms such as the limpet. Students count the organisms present in each quadrant of the photo, and log the data on the provided data spreadsheet (or have them create their own). The activity wraps up with data analysis questions that utilizes content from unit 2 and 3, see preview photos. These questions, the whole PPT, is / are fully editable.
*The new and upcoming AICE AS curriculum / text / syllabi will require students to perform the Simpson's diversity index calculation, so I've included this resource as an AICE marine resource.
Vocabulary Used in This Resource:
Quadrant, abiotic factors, carrying capacity, mussels, limpets, barnacles, ecological tolerance, populations, generalist / specialist species, adaptations, distribution (of species), Simpson's diversity index (and a calculation of this index for one of the 3 sites)
✐ ✏ ✐ ✏ ✐ ✏ ✐ ✏ ✐ ✏ ✐ ✏ ✐ ✏ ✐ ✏ ✐ ✏ ✐ ✏ ✐ ✏
* Please be sure to rate this resource! (Thank you!)
* Click here to follow me! (Followers receive the inside scoop into upcoming sales, etc)
* Email me at thatmarinescienceguy@gmail.com if you have any issues with this resource. As a purchaser, you can get updates as I improve or update this resource!
✐ ✏ ✐ ✏ ✐ ✏ ✐ ✏ ✐ ✏ ✐ ✏ ✐ ✏ ✐ ✏ ✐ ✏ ✐ ✏ ✐ ✏
Quick links for other items available in my store:
- Video Anticipation Guides
- Sub / Emergency Lesson Plans
- $2 and Under Items
- AICE Marine Science AS Level Resources
- APES Environmental Science Resources
- Biology Resources
- All Virtual Interactive Labs
- All Review Games (pre-made)
- Classification
- Currents (Surface & Deepwater)
- Ecosystems (Reefs, estuaries, atolls, etc)
- El Nino
- Food Chains, Trophic Levels, & Plankton
- Food Webs & Energy Transfer
- Life in the Ocean
- Marine Geology
- Natural Selection & Adaptations
- Scientific Method / Density
- Symbiosis & Invasives
- Succession
- Tides
- Unique Properties of Water
- Heat Capacity & Climate
- Water, Carbon, Nitrogen Cycles
- Waves
Terms of Use: © Copyright That Marine Science Guy. All rights reserved by author. This product is to be used by the original purchaser only. Copying for more than one teacher or classroom, or for an entire department, school, or school system is prohibited. This product may not be distributed or displayed digitally for public view, uploaded to school or district websites, distributed via email, or submitted to file sharing sites such as Google Drive, or Amazon Inspire. Failure to comply is a copyright infringement and a violation of the Digital Millennium Copyright Act (DMCA). Intended for single classroom and personal use only.


