
Line of Best Fit and Scatterplots


- PDF
What educators are saying
Also included in
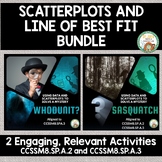 This bundle includes 2 engaging activities where students can apply the skills of plotting points in a scatterplot, making a line of best fit, and finding the slope of the line to find missing data. Fun scenarios of Sasquatch and a crime scene hook kids into learning. Please leave feedback, you caPrice $4.00Original Price $5.00Save $1.00
Description
Who doesn't love a good mystery?!!!! In this engaging students use a real life scenario to apply scatterplot data of shoe size and height and the line of best fit to capture the correct suspect. This product has lots of great reviews! Many middle school math teachers state this was a great way to review the concept of line of best fit and scatterplots.
Aligned to CCSSM8.SP.A.2 and CCSSM8.SP.A.3
This activity is also available in a bundle at a discounted rate:
Scatterplots and Line of Best Fit Bundle
Please leave feedback and earn TpT credits for future purchases.
If you like this activity, consider following my store and check out these similar middle school math products:
Scatterplots and Line of Best Fit and Sasquatch
Zombie Apocalypse and Exponential Decay
Line of Best Fit: Barbie Bungee Challenge
Design and Aquatic Park: Project Based Learning
Identifying exponential and linear growth
