
Line Plots with Fractions Worksheets Activity 4th Grade Interpret Data & Graphs


- PDF
- Google Apps™

What educators are saying
Also included in
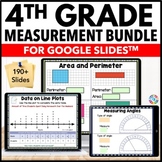 Make practice and review fun with the interactive activities in this huge 4th Grade Measurement and Data Digital Worksheets Bundle. With over 190 slides included for all 4th grade measurement and data skills (measurement conversions, elapsed time, area & perimeter, line plots, measuring angles,Price $30.25Original Price $36.85Save $6.60
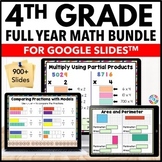 Make your 4th grade math worksheets interactive with these digital math review packets for Google Slides™. This huge bundle of 4th grade math review covers all math standards for place value, operations, fractions, decimals, measurement, data, geometry, and word problems. With over 900 4th grade matPrice $139.25Original Price $176.95Save $37.70
Description
Engage your students in interpreting graphs and data with these interactive 4th Grade Line Plots with Fractions Worksheets for Google Slides™. While working through these digital line plots activities, your students will practice making line plots, interpreting data on line plots with fractions (1/2, 1/4, 1/8), and solving fraction addition and subtraction problems using line plots. With 21 slides of activities included, you'll have a full supply of ready-to-go practice & review opportunities for your graphing and data with line plots unit!
This 4th grade line plots activity works with Google Slides™. Just choose the slides you want to use and assign them to your students. Students love interacting with the movable pieces and typing their responses on these slides!
When you purchase this DIGITAL line plots resource, you'll receive:
- Instructions for opening, sharing, and using this Google Slides™ file
- 21 interactive slides for your students to complete
- Teacher answer key
✅ Want to learn more? Click on the green "Preview" button above!
IMPORTANT: This is a digital resource, so please only purchase this resource if you have the capabilities in your classroom to use it (computers, laptops, or tablets, Internet access, and a Google account).
If you have any issues with this resource, please feel free to email me directly at brittney@games4gains.com. I'll be happy to try to help you!
Think ahead and save $$ by buying a bundle...
Looking for more digital resources for 4th grade measurement?
- 4th Grade Customary Measurement Conversions Digital Practice
- 4th Grade Metric Measurement Conversions Digital Practice
- 4th Grade Elapsed Time and Time Conversions Digital Practice
- 4th Grade Measurement Digital Self-Grading Assessments
Your students may also like:
- 4th Grade Measurement & Data Games Pack
- 4th Grade Line Plots with Fractions 'Clip and Flip' Cards
- Line Plots Board Game
Customer Tips:
We love to hear what you think! Please leave your feedback on this resource to earn credit points to save money on future purchases!
Click on the green ★ above to follow my store to get notifications of new resources, sales, and freebies!
© Games 4 Gains, LLC.
This purchase is for single-classroom use only. Sharing this resource with multiple teachers, an entire school, or an entire school system is strictly forbidden. Multiple licenses are available at a discount.
