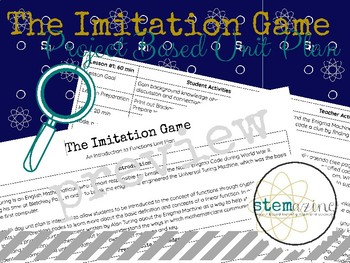
Intro to Functions Unit Plan--Project Based Learning 8th Grade Math and Algebra
Stemazing PBL
31 Followers
Grade Levels
7th - 9th
Subjects
Resource Type
Standards
CCSS8.F.A.1
CCSS8.F.A.2
CCSS8.F.A.3
CCSS8.F.B.4
CCSSHSF-IF.A.1
Formats Included
- PDF
Pages
23 pages
Stemazing PBL
31 Followers
What educators are saying
I absolutely loved this resource! I used it as a part of a cryptography unit with my 7th grade GT group and it was such a blast. They learned a ton from it and I am going to make it a regular unit each year for that age group because of how much I enjoyed it. Thank you!
Description
Explore functions through the lens of cryptography with this engaging unit plan! Not only will students be cracking codes and creating their own, but they will also be exploring the history behind cryptography during WWII and examining primary sources!
This unit includes 7 DETAILED lessons with needed resources including a project rubric, keys for each code, graphic organizers, and room for you to add your own teaching resources and personality.
This unit includes 7 DETAILED lessons with needed resources including a project rubric, keys for each code, graphic organizers, and room for you to add your own teaching resources and personality.
Total Pages
23 pages
Answer Key
Included
Teaching Duration
2 Weeks
Report this resource to TPT
Reported resources will be reviewed by our team. Report this resource to let us know if this resource violates TPT’s content guidelines.
Standards
to see state-specific standards (only available in the US).
CCSS8.F.A.1
Understand that a function is a rule that assigns to each input exactly one output. The graph of a function is the set of ordered pairs consisting of an input and the corresponding output.
CCSS8.F.A.2
Compare properties of two functions each represented in a different way (algebraically, graphically, numerically in tables, or by verbal descriptions). For example, given a linear function represented by a table of values and a linear function represented by an algebraic expression, determine which function has the greater rate of change.
CCSS8.F.A.3
Interpret the equation 𝘺 = 𝘮𝘹 + 𝘣 as defining a linear function, whose graph is a straight line; give examples of functions that are not linear. For example, the function 𝘈 = 𝑠² giving the area of a square as a function of its side length is not linear because its graph contains the points (1,1), (2,4) and (3,9), which are not on a straight line.
CCSS8.F.B.4
Construct a function to model a linear relationship between two quantities. Determine the rate of change and initial value of the function from a description of a relationship or from two (𝘹, 𝘺) values, including reading these from a table or from a graph. Interpret the rate of change and initial value of a linear function in terms of the situation it models, and in terms of its graph or a table of values.
CCSSHSF-IF.A.1
Understand that a function from one set (called the domain) to another set (called the range) assigns to each element of the domain exactly one element of the range. If 𝘧 is a function and 𝘹 is an element of its domain, then 𝘧(𝘹) denotes the output of 𝘧 corresponding to the input 𝘹. The graph of 𝘧 is the graph of the equation 𝘺 = 𝘧(𝘹).


